
Figure 2.
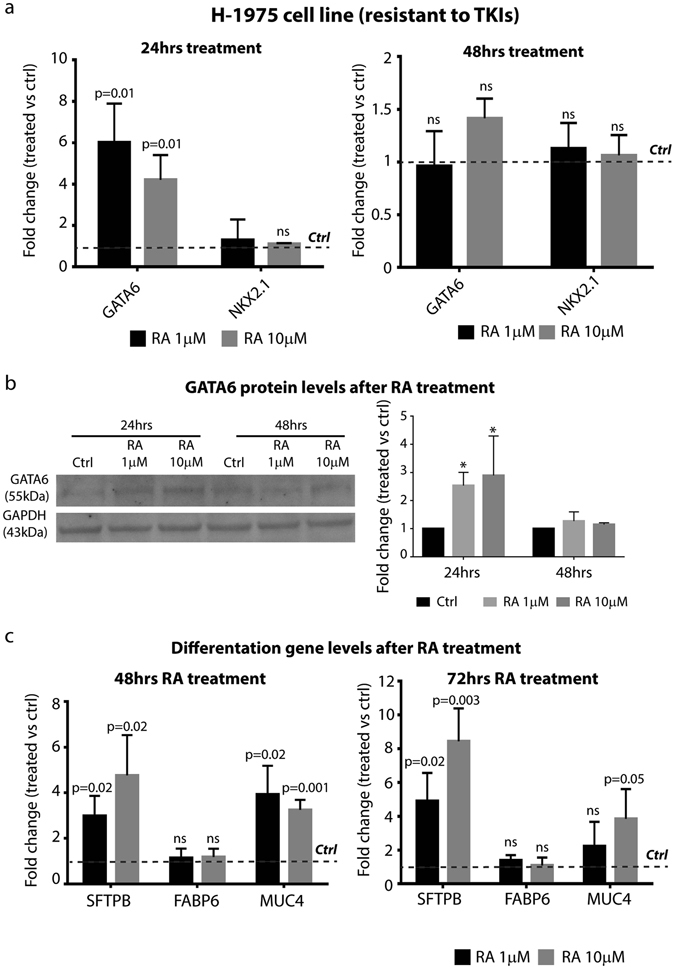
RA treatment induces TKI resistant NSCLC cell differentiation. (a) qRT-PCR analysis of GATA6 and NKX2.1 in H-1975 NSCLC cell line treated with 1 and 10 µM RA for 24 and 48 hrs. The comparison has been conducted by using the ΔΔCT method and normalized to GAPDH transcript. Dotted line represents the normalized expression levels of each transcript analyzed in untreated cells. Data are represented as mean ± SD. Statistical analysis has been obtained by paired t test (n = 3). (b) Left panel, Representative Western blotting analysis of GATA6 and GAPDH in H-1975 cells treated with 1 and 10 µM RA for 24 and 48 hrs. Right panel, densitometric analysis of GATA6 levels, normalized versus GAPDH, used as loading control (n = 4) (*=0.02). (c) qRT-PCR analysis of GATA6 target genes in H-1975 NSCLC cells treated with 1 and 10 µM RA for 48 and 72 hrs. The comparison has been conducted by using the ΔΔCT method and normalized to GAPDH transcript. Dotted line represents the normalized expression levels of each transcript analyzed in untreated cells. Data are represented as mean ± SD. Statistical analysis has been obtained by unpaired t test (n = 3).