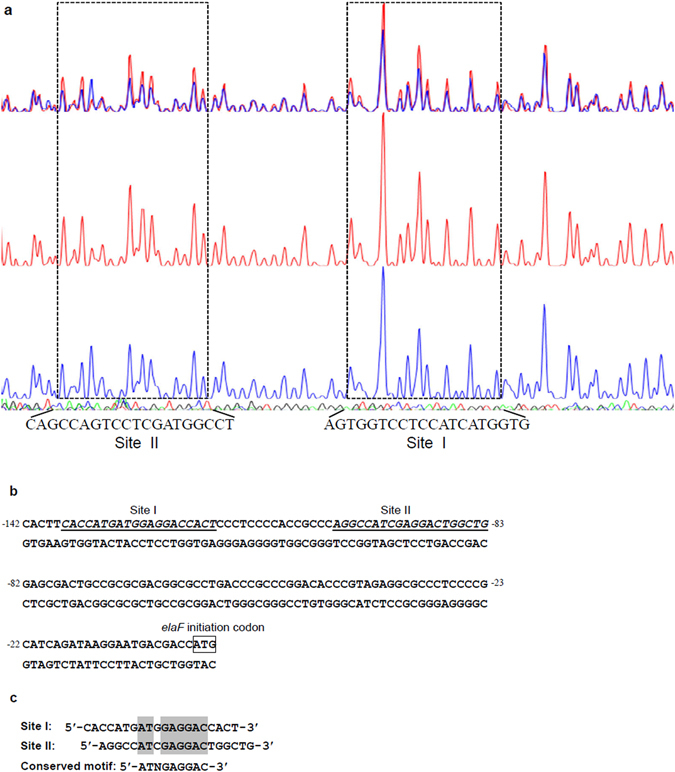
Figure 6.

Determination of the binding sites of of GdmRIII. (a) DNase I footprinting assay of the elaF promoter protected by GdmRIII. The middle electropherogram represents the sequencing reaction without GdmRIII protein and the lower electropherogram represents the reaction with GdmRIII protein added. The regions where the blue peaks are constantly lower than the red peaks are considered to be protected by GdmRIII; (b) the nucleotide sequence of the elaF promoter region and the GdmRIII binding sites. The numbers indicate the distance (nt) from the translational start point. The solid lines indicate the GdmRIII binding sites. (c) the conserved sequence among GdmRIII binding sites.
