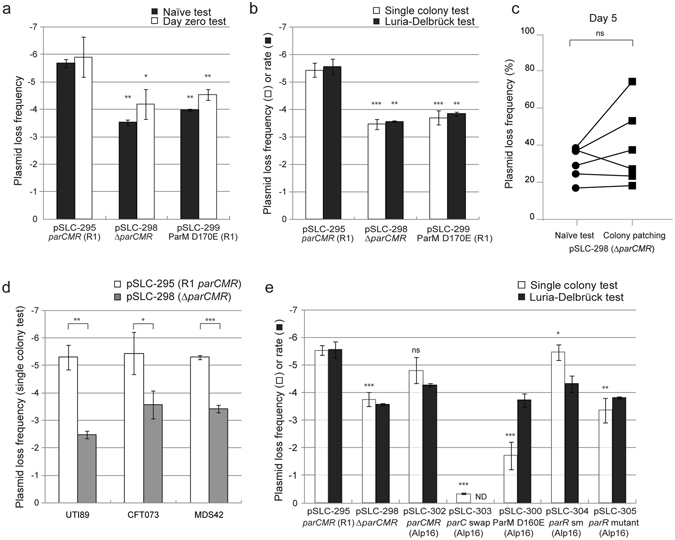
Figure 3.

Contribution of parCMR systems to plasmid stability. Plasmid loss frequencies and rates for test plasmids carrying E. coli/Salmonella R1 parCMR mutations in the lab strain MDS42 determined using the naïve and day zero tests (a) and the single colony and Luria-Delbrück tests (b). Significant differences from the plasmid loss frequency of pSLC-295 were tested using a 2-tailed Student’s t-test on log transformed values. ns indicates p > = 0.05; *p < 0.05; **p < 0.01; ***p < 0.001. (c) Comparison of plasmid loss frequencies as measured by the naïve test and patching of individual colonies. MDS42 carrying plasmid pSLC-298 (ΔparCMR) was passaged without antibiotics for 5 days (n = 3 for each of 2 independent biological experiments). The same culture was assayed for plasmid loss frequency by both tests; results for the same culture are indicated by a connecting line between the data points. There was no significant difference (p = 0.3125, Wilcoxon signed rank test) in measured loss frequencies between the tests. (d) Measurement of test plasmid stability in clinical isolates (UTI89 and CFT073) compared with those measured in a lab strain (MDS42). Significant differences between pSLC-295 and pSLC-298 for each host strain are calculated and indicated as in panels (a) and (b). (e) The Clostridium perfringens Alp16 parCMR system functions similarly to the R1 parCMR system. Plasmid loss tests for MDS42 cells carrying plasmids with mutants of the Alp16 parCMR system (indicated on the x-axis) using the single colony and Luria-Delbrück tests. Significant differences are calculated and indicated as in panels (a) and (b). Comparisons for pSLC-298 and pSLC-302 are against pSLC-295. Comparisons for pSLC-303, pSLC-300, pSLC-304, and pSLC-305 are against pSLC-302. ND, not determined. For all graphs, plasmid loss frequency data are plotted as the mean of log-transformed values from at least three independent experiments with error bars indicating standard deviations, while the Luria-Delbrück rate data are plotted as the mean of log-transformed values from at least two independent experiments with error bars depicting the range between the two values. Significance was tested for differences in Luria-Delbrück rates only when > = 3 experimental replicates were performed.
