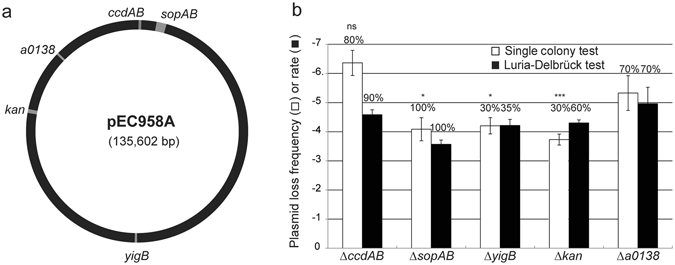
Figure 4.

Direct measurement of pEC958 plasmid stability in its native host strain, EC958. (a) Genetic map of plasmid pEC958 indicating the location of genes (highlighted in gray) replaced by the negative selection cassette. (b) Plasmid stability measured in EC958. Raw plasmid loss frequencies (assayed using the single colony test, white bars) or rates (assayed using the Luria-Delbrück test, black bars) are plotted with error bars as in Fig. 3. Numbers above each bar indicate the percentage of colonies growing that are truly plasmid-free based on antibiotic resistance and PCR for plasmid-specific sequences. Significant differences in plasmid loss frequency were calculated relative to pSLC-344 (pEC958 ∆a0138) using a 2-tailed Student’s t-test on log transformed values. ns indicates p > = 0.05; *p < 0.05; ***p < 0.001. Plasmid loss frequency data are plotted as the mean of log-transformed values from at least three independent experiments with error bars indicating standard deviations, while the Luria-Delbrück rate data are plotted as the mean of log-transformed values from at least two independent experiments with error bars depicting the range between the two values. Significance was tested for differences in Luria-Delbrück rates only when > = 3 experimental replicates were performed.
