Figure 1.

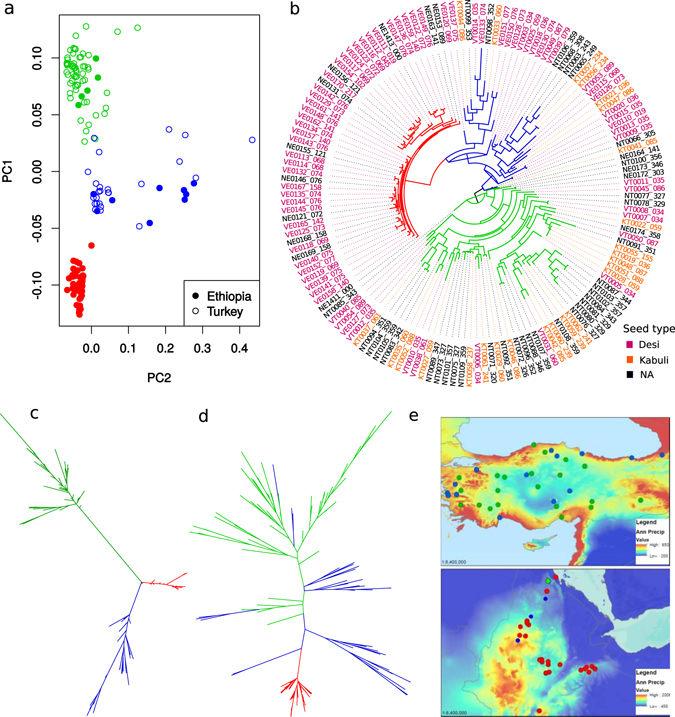
Analysis of 14,059 genome-wide SNP reveals patterns associated with chromosome of origin, geographical distribution, and a secondary bottleneck from Turkey to Ethiopia. Colour scheme in all panels of the figure (red, green and blue) corresponds to separation of accessions on PC-plot (a), into three clades on whole genome tree (b) and into three clades on chromosome 4 tree (c). (a) Principal component plot constructed for all SNPs separates accessions by the country of origin (Ethiopia and Turkey) and reveals three clusters that correspond to genetic structure revealed on maximum likelihood tree of all accessions shown in (b). (b) Maximum likelihood phylogenetic tree for the chickpea landraces based on the whole genetic material. (c) Maximum likelihood phylogenetic tree showing relationships among accessions based on chromosome 4 SNPs, and (d) the rest of the genome. (e) Geography of accessions with origin in Turkey or Ethiopia84, (the map was created with ArcGIS 10.3.1 software, http://www.esri.com/). Map coloration depicts annual precipitation – a variable predictive of the plant phenology. Twenty of 45 Ethiopian accessions were collected in Addis Ababa and appear as a single point on the graph.
