Figure 3.

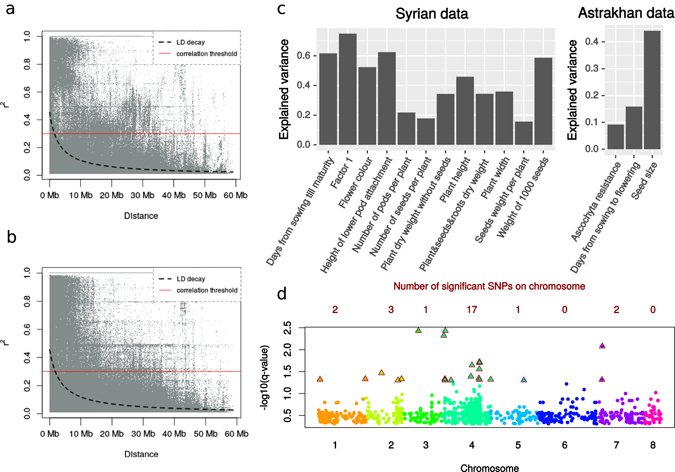
Genomic analyses reveal genetic control of traits and an enrichment of trait associations on chromosome 4 (a) LD measured by r2 as a function of genetic distance between SNPs for all landraces and (b) for landraces from Turkey. (c) Proportion of phenotypic variance explained by genotype for different traits. y-axis ratio of genetic variance to phenotypic variance of a trait, x-axis – different trait phenotypes. (d) Summary of GWAS analyses for Astrakhan (Russia) and Allepo (Syria) phenotype data (different colours corresponds to different chromosomes). SNPs with q-value < 0.05 are shown for each chromosome, marked as triangles. When one position associates with a number of phenotypes with different q-values, only the most significant SNP is represented.
