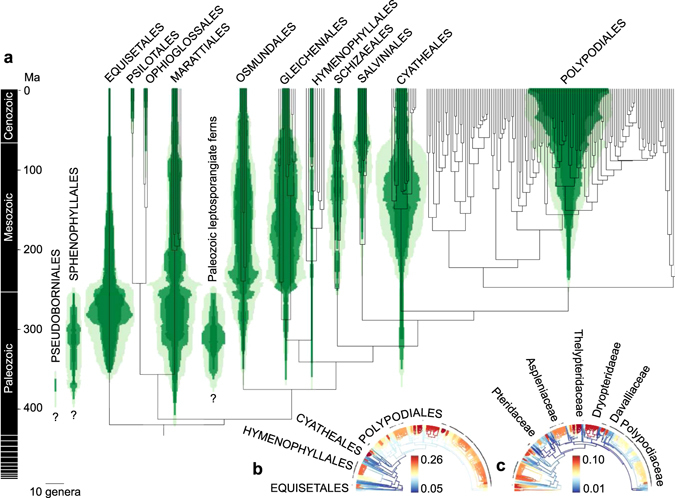
Figure 2.

Diversification dynamics of ferns through time. (a) The green diagrams show the diversity dynamics of fern genera that were assigned to higher taxa (orders) inferred from the fossil record (Supplementary Table 1), plotted above a time-calibrated molecular phylogeny collapsed to the genus level. Pale green indicates the estimated maximum diversity (95% HPD), dark green the estimated minimum (95% HPD), and intermediate green the estimated mean diversity. (b) Diversification rate shifts identified from a species-level phylogeny for speciation and (c) extinction rates. Some important higher taxa (orders in b and families in c) are labelled and epiphytic species indicated by dots.
