Figure 2.

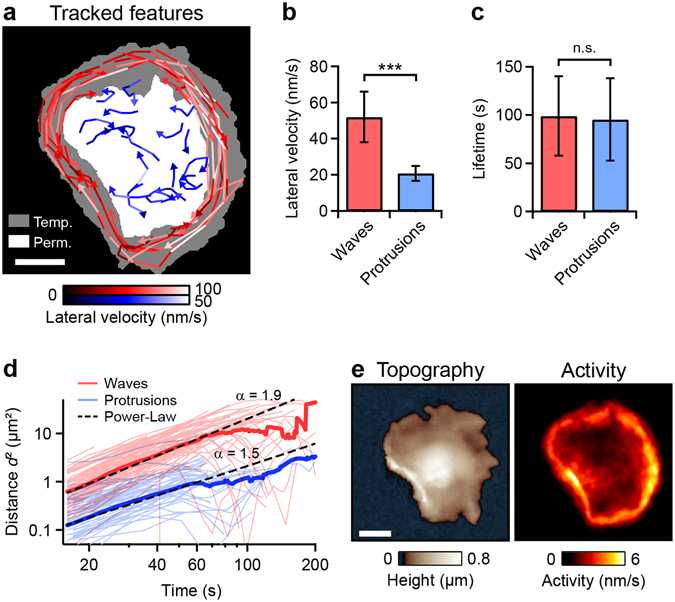
Two modes of dynamics. (a) Traces of tracked lamellipodium waves (red) and protrusions (blue) for the thrombin-stimulated platelet shown in Fig. 1c. The brightness of a trace indicates the lateral velocity (s. respective color scale). The areas with the white, grey, and black backgrounds were permanently, temporarily, and never, respectively, covered by the dynamic platelet. (b) Average lateral velocity and (c) average lifetime of lamellipodium waves (n = 72 on 3 different platelets) and protrusions (n = 69). (d) Mean squared distance (MSD, bold curves) and squared distances of single traces (thin curves) as a function of time, for all tracked lamellipodium waves and protrusions. Each MSD-curve showed a power-law behavior (dashed lines) for times below t = 60 s. (e) Topography and morphological activity of the platelet shown in panel a. The morphological activity is defined as height change per time (s. “Methods” for details) and shows local changes of the platelet morphology. Areas of high activity correspond to areas with fast and frequently moving features. ***(P < 0.001) indicates statistically significant difference. Error bars: standard deviation. Scale bars: 2 µm.
