Figure 1.
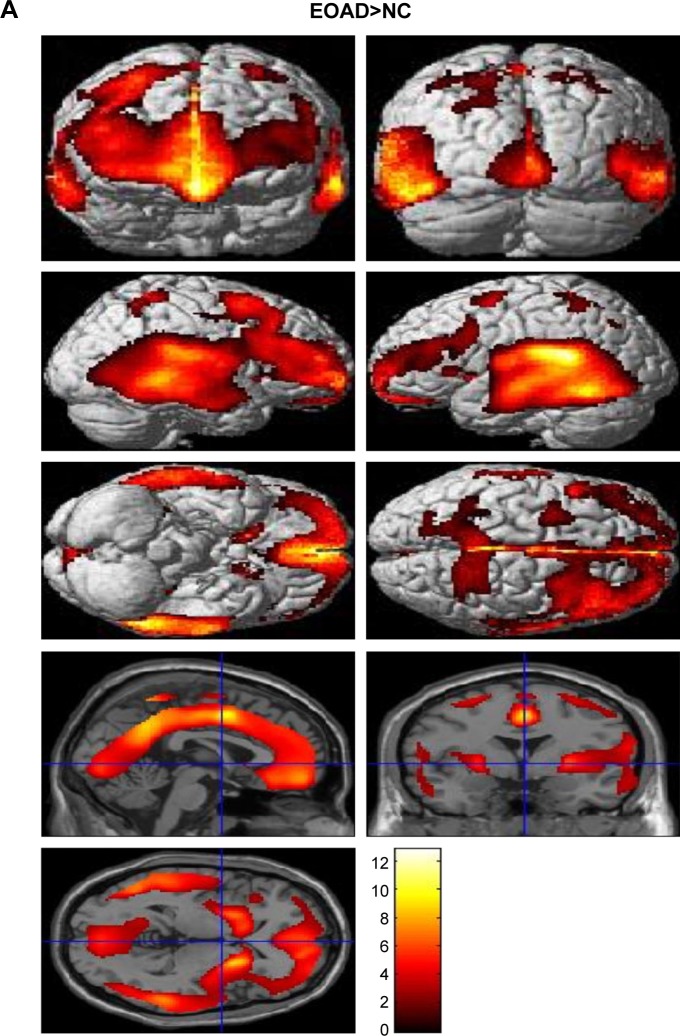
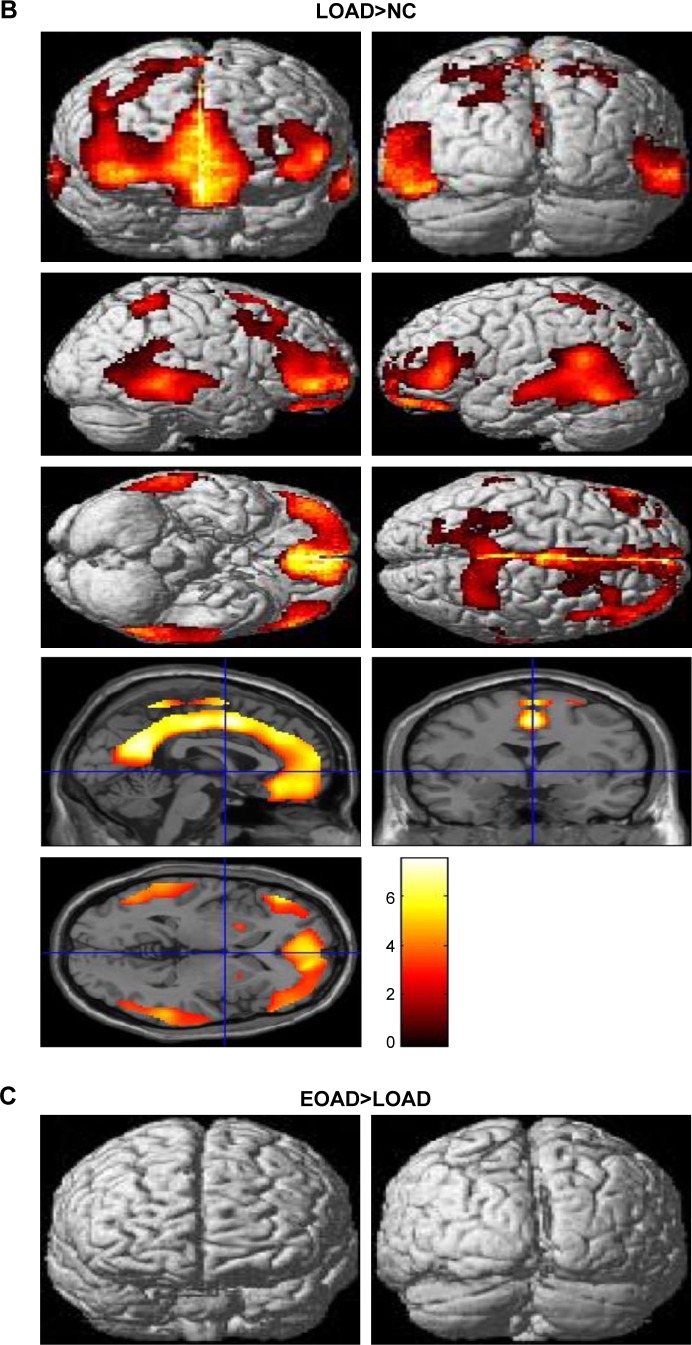
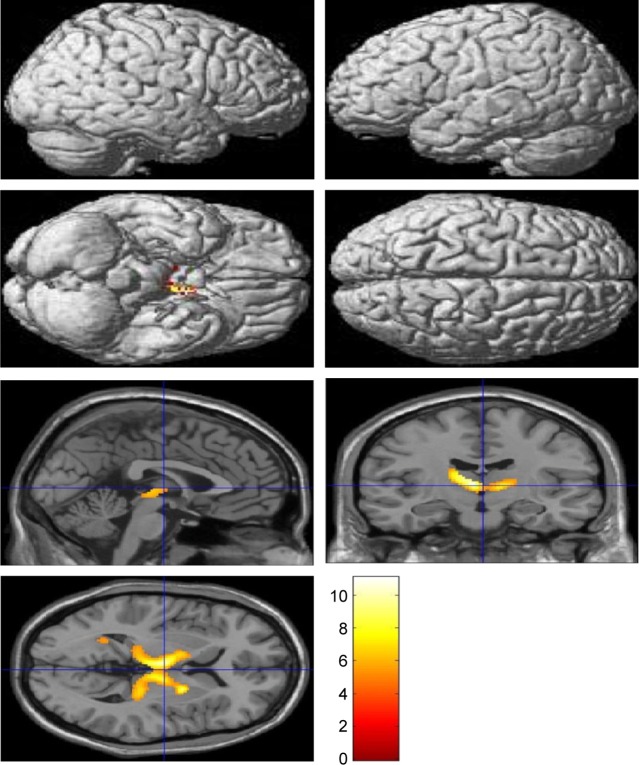
Statistical parametric maps (P<0.05, FDR; extent threshold =50 voxels) of Pittsburgh compound B retention in (A) the EOAD group compared with the NC group, (B) the LOAD group compared with the NC group and (C) the EOAD group compared with the LOAD group. The color scale indicates the z value magnitude, with the lowest value appearing in dark red and the highest value in bright yellow/white.
Abbreviations: EOAD, early-onset Alzheimer’s disease; FDR, false discovery rate; LOAD, late-onset Alzheimer’s disease; NC, normal control.


