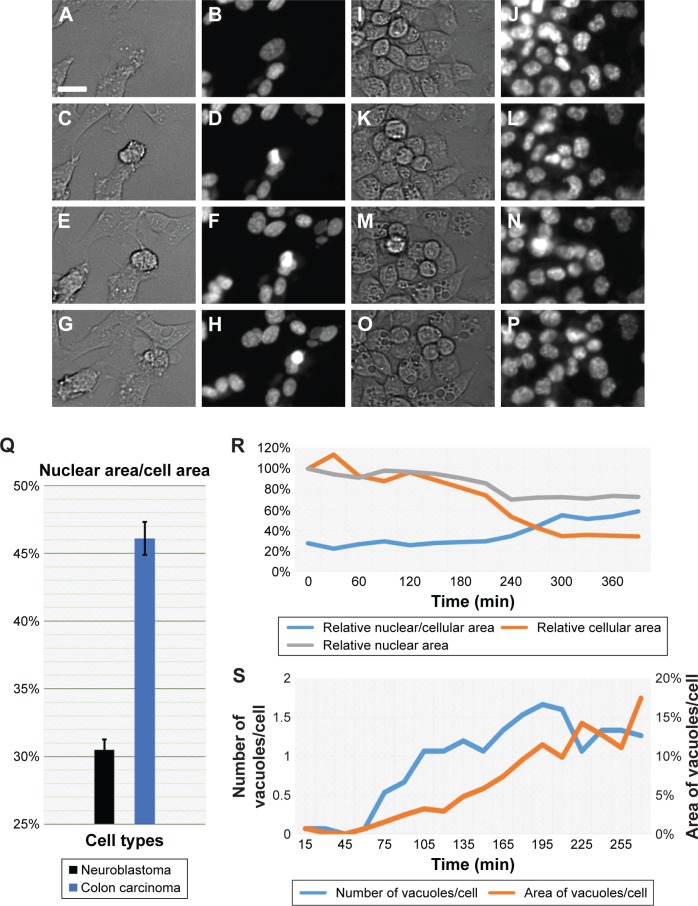
Figure 3.
Phenotype-based drug discovery endpoints of intracellular features.
Notes: (A–H) Brightfield (A–G) and Hoechst staining of the nucleus (B–H) images of selected time points showing morphological changes in neuroblastoma over a period of 7 h. (I–P) Brightfield (I–O) and nuclear staining (J–P) of colon carcinoma cells over a period of 7 h. (Q) Graph showing the overall difference between cells and nuclear area of neuroblastoma and colon carcinoma cells. (R) Relative changes to cell and nuclear area over a period of 7 h in colon carcinoma cells. (S) Measurement of the number of vacuoles and the area they occupy in colon carcinoma cells over a period of 6 h. Scale bar: 25 μm; brightfield images of cells and Hoechst-stained nucleus are shown.

