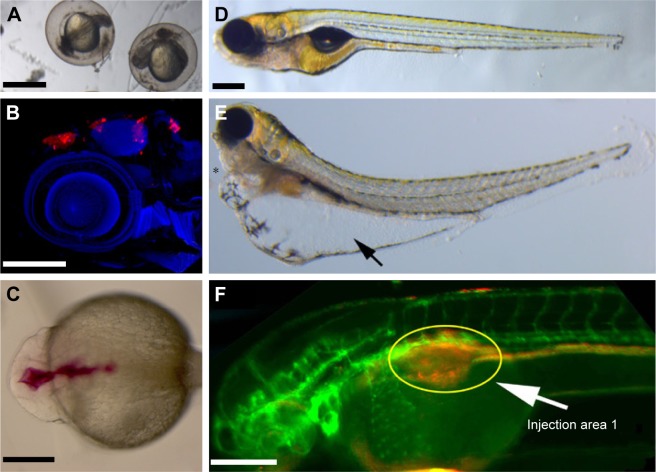
Figure 5.
Phenotype-based drug discovery endpoints for zebrafish-based screening.
Notes: (A) Zebrafish developmental assay showing a brightfield image of embryos with developmental deformities. (B) Zebrafish-based brain tumor xenograft assay with the transplanted cells stained in red and embryos’ cell nuclei stained with 4′,6-diamidino-2-phenylindole staining. (C) Zebrafish brain ventricle development assay with a red dye injected into brain ventricle. (D, E) Zebrafish-based larval assay showing normally developing larvae compared to larvae with edema in yolk (arrow) and heart (asterisk). (F) Transgenic zebrafish expressing green fluorescent protein in blood vessels and with transplanted cancer cells labeled with a red dye. The transplanted site is shown with a yellow circle and an arrow. Scale bars: 100 µm in panel (A), 250 µm in panels (B) and (C), and 250 µm in panels (D–F).

