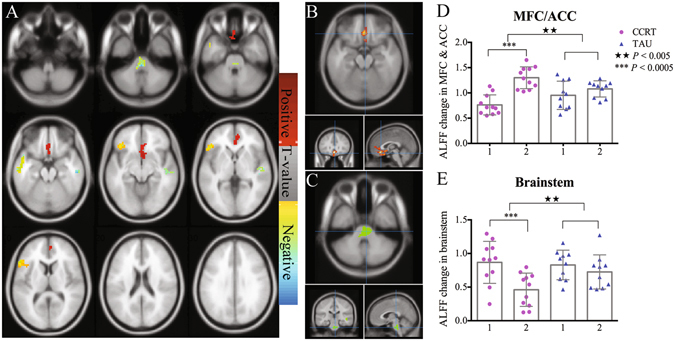
Figure 3.

Amplitude of low-frequency fluctuation (ALFF) changes after CCRT. Paired t-test results in CCRT group were shown in Fig. 2A. And two areas shown significant interaction between group and time are plotted in Fig. 2B and C. The scatter plots of the two regions are also drawn (D and E). Note: in x axis of Fig. 2D and E, 1 = baseline, 2 = post-treatment. ★Means significant group × time interaction, *means significant treatment effect within group.
