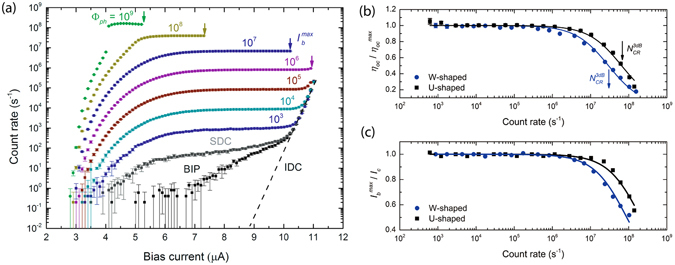
Figure 3.

Measurement of the single-photon detector (SNSPD) performance. (а) Count rate of the W-shaped nanowire vs bias current, at different levels of optical power at 1550 nm wavelength. The photon flux is shown above each curve and marked by individual colors. The count rate when the laser is turned off but connected to an optical fiber at a room temperature is marked by SDC. The count rate with a closed metal cup is marked as BIP. The intrinsic dark counts marked as IDC (b) Dependence of the normalized on-chip detection efficiency (η oc) on count rate. The black squares correspond to the measured data for U-shaped nanowire, while the blue dots for W-shaped nanowire. The fitted values are represented with solid lines and the arrows indicate the count rate at which (с) Normalized maximum current vs count rate. The black squares represent the measured dependence for U-shaped detector, while the blue dots for the W-shaped detector. The fitted values are represented with solid lines.
