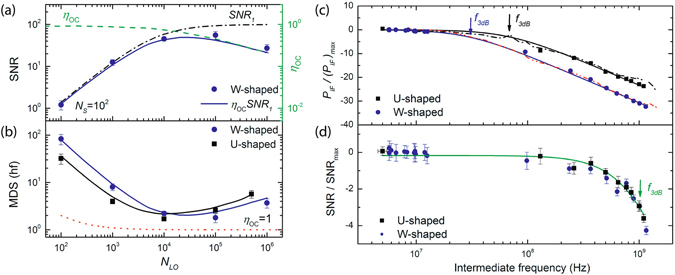
Figure 5.

Measurement of the SNSPD performance as coherent detector. Blue dots correspond to the W-shaped nanowire and black squares to U-shaped nanowire. (a) Measured SNR vs N LO at a constant signal N S = 102. The green dashed line shows the measured dependence of η oc (N LO) and the black dash-dotted line represents the calculated SNR1 with extracted data of N eff. The blue solid line is the result of multiplication of η oc (N LO) and SNR1 (b) Minimum detectable signal (MDS) in terms of single photons vs N LO. The red dotted line shows the MDS for ideal shot noise limited detector (c) Measured IF bandwidth for both types of detectors. The dash-dotted lines show the Fast Fourier transform of a pulse detector. The fitted values are represented with solid lines and the arrows indicate the IF frequency f 3dB at which power decreases in two times. (d) Noise bandwidth vs f IF. The fitted values are represented with the green solid line and the arrows indicate the IF frequency f 3dB at which SNR decreases in two times.
