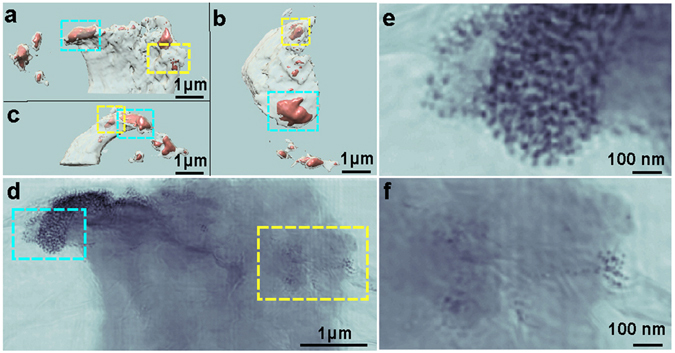
Figure 3.

STXM tomography reconstruction of the leading edge of a HeLa cell. (a–c) Iso-renderings of the 3D reconstruction showing several high-density regions (orange) within the cell, viewed along the z-, minus y- and x-axes, respectively. (d) High-resolution ptychographic image confirming that the internalized high-density regions correspond to nanoparticles uptaken by the cell. (e and f) Magnified views of two regions in (d) labeled with cyan and yellow rectangles, respectively.
