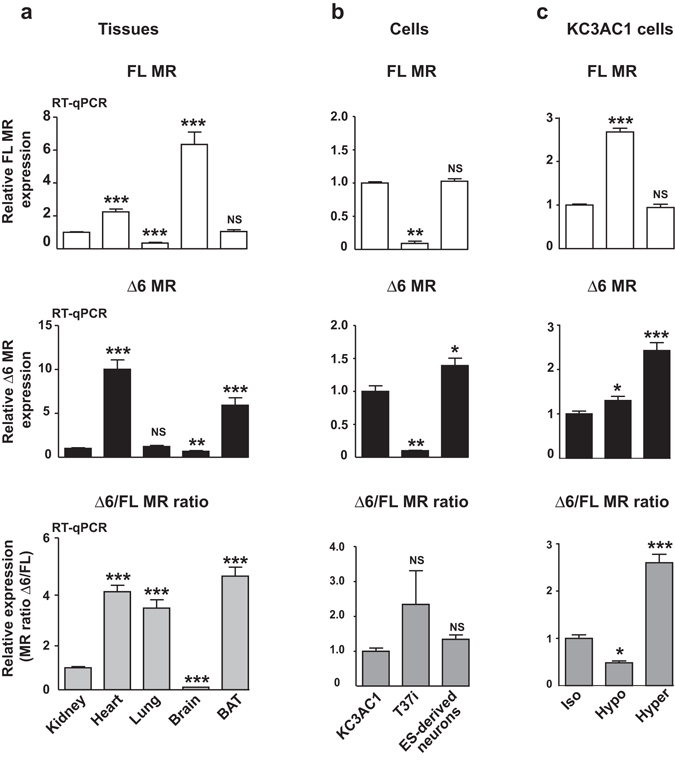
Figure 3.

Δ6 MR is expressed in mouse MR-expressing tissues and cells, and is regulated by extracellular tonicity. (a,b) RT-qPCR analysis of MR expression (FL and Δ6 MR). The FL MR and Δ6 MR transcripts were reverse-transcribed and amplified with Taqman probes from several mouse epithelial and non-epithelial MR-expressing tissues (kidney, heart, lung, brain and brown adipose tissue, BAT) or cell lines (KC3AC1, T37i cells, ES-derived neurons). The expression of FL MR or Δ6 MR, normalized relative to 18s rRNA, is expressed as a fold-induction relative to the level of expression in the kidney or in KC3AC1 cells, arbitrary set at 1. The Δ6/FL MR ratio was also determined for each tissue or cell line. The data shown are means ± SEM (n = 12–18) of two and three independent experiments, for each tissue and cell line, respectively. **P < 0.01; ***P < 0.001; NS = not significant (Mann-Whitney U-tests). (c) MR expression (FL MR and Δ6 MR) was also analyzed by RT-qPCR in KC3AC1 cells subjected to isotonic (Iso), hypotonic (Hypo) or hypertonic (Hyper) conditions for 6 hours. FL MR or Δ6 MR expression is presented as described above (fold-induction relative to the level of expression in control cells [Iso], arbitrarily set at 1). The Δ6/FL MR ratio was also determined for each set of conditions. The data shown are means ± SEM (n = 16) of two independent experiments. *P < 0.05; **P < 0.01; ***P < 0.001; NS = not significant (Mann-Whitney U-tests).
