
Figure 4.
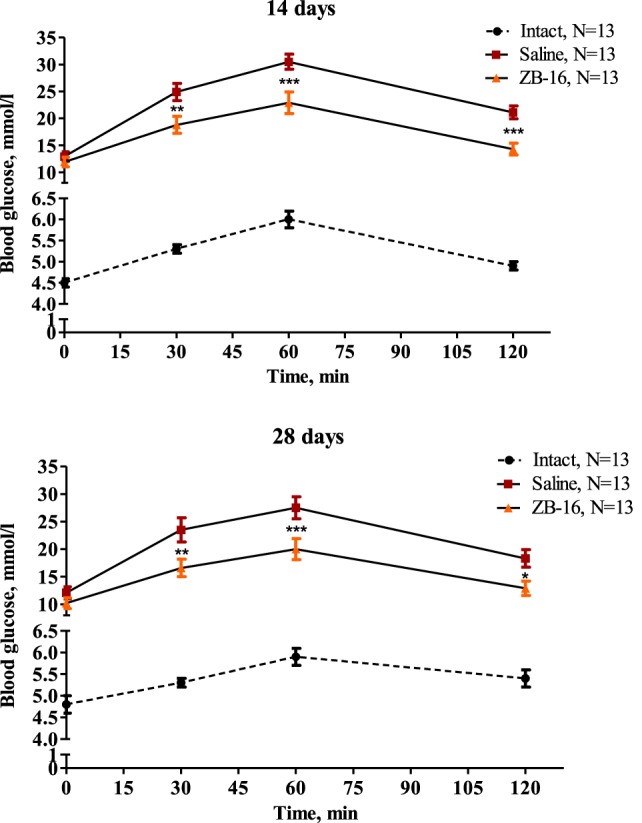
Glucose tolerance test performed on the 14th and 28th day of the experiment. Blood glucose levels measured during the oral glucose tolerance test on 14th and 28th day of the experiment are shown as M ± SEM. The test was performed on overnight fasted animals given 3 g/kg of 40% glucose solution via intragastral gavage. Black circles—intact group of healthy animals, receiving saline (5 ml/kg per os); red rectangles—control group with streptozotocin–nicotinamide diabetes (StD), receiving saline (5 ml/kg per os); and orange triangles—experimental group with StD, receiving the novel GPR119 agonist ZB-16 (1 mg/kg, dissolved in 5 ml/kg of saline, per os). Repeated measures two-way ANOVA: time—p < 0.0001; treatment—p < 0.0001; time × treatment—p < 0.0001 for both testing days. Newman–Keuls post hoc test: *p < 0.05, **p < 0.01, and ***p < 0.001 between saline and ZB-16 groups; and for intact group p < 0.001 both with control and ZB-16 groups in all time points.