
Figure 5.
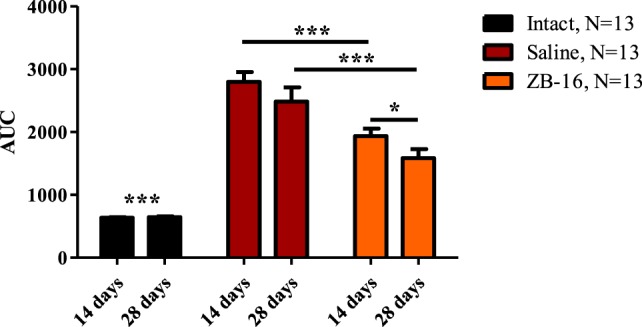
Area under the curve “Blood glucose vs. Time” during the glucose tolerance test. The figure demonstrates the area under the curve “blood glucose/time” plotted during the oral glucose tolerance test on 14th and 28th day of the experiment. Data are shown as M ± SEM. The test was performed on overnight fasted animals given 3 g/kg of 40% glucose solution via intragastral gavage. Black—intact group of healthy animals, receiving saline (5 ml/kg per os); red—control group with streptozotocin–nicotinamide diabetes (StD), receiving saline (5 ml/kg per os); orange—experimental group with StD, receiving the novel GPR119 agonist ZB-16 (1 mg/kg, dissolved in 5 ml/kg of saline, per os). Two-way ANOVA: time—p = 0.0018; treatment—p < 0.0001; time × treatment—p = 0.0629. Newman–Keuls post hoc test: *p < 0.05, ***p < 0.001 (comprised data sets are shown with horizontal lines); for intact group p < 0.001 both with control and ZB-16 groups.