
Figure 6.
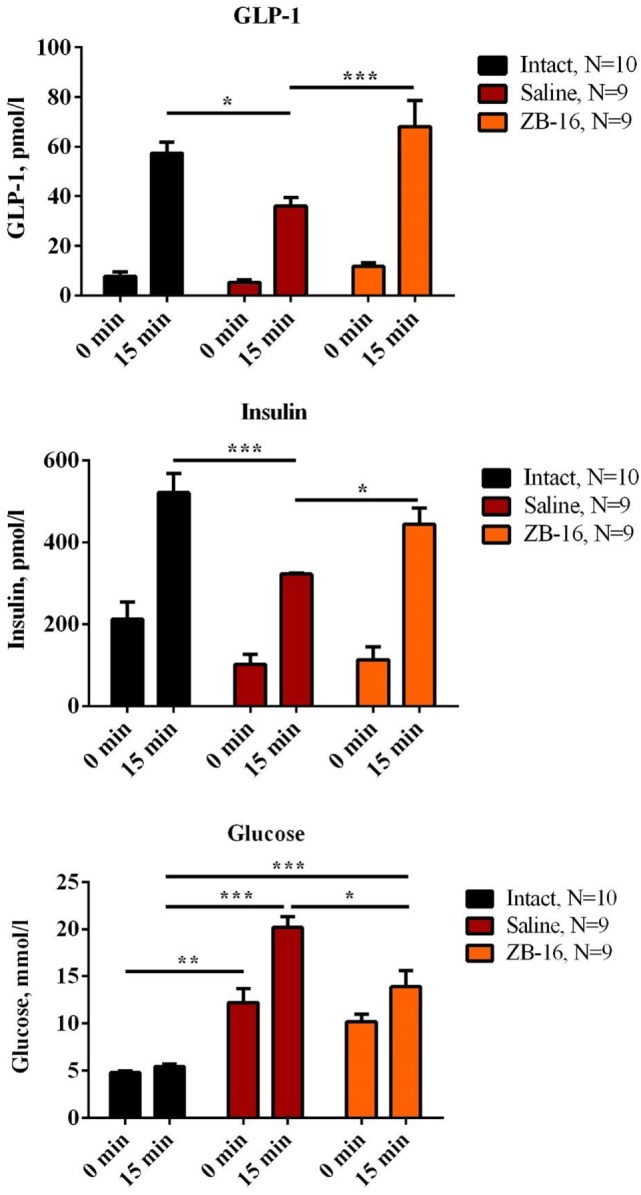
The effects of GPR119 agonist ZB-16 on glucagon-like peptide-1 (GLP-1) and insulin concentrations after the glucose load on the 28th day of experiment. The figure demonstrates the blood plasma concentrations of GLP-1 and insulin measured on 28th day of experiment during the oral glucose tolerance test. Data are shown as M ± SEM. The test was performed on overnight fasted animals given 3 g/kg of 40% glucose solution via intragastral gavage. Black—intact group of healthy animals, receiving saline (5 ml/kg per os); red—control group with streptozotocin–nicotinamide diabetes (StD), receiving saline (5 ml/kg per os); orange—experimental group with StD, receiving the novel GPR119 agonist ZB-16 (1 mg/kg, dissolved in 5 ml/kg of saline, per os). Two-way ANOVA: GLP-1: time—p < 0.0001; treatment—p = 0.0060; and time × treatment—p = 0.0310. Newman–Keuls post hoc test: *p < 0.05, ***p < 0.001 (comprised data sets are shown with horizontal lines). Insulin: time—p < 0.0001; treatment—p = 0.0043; and time × treatment—p = 0.0870. Newman–Keuls post hoc test: *p < 0.05, ***p < 0.001 (comprised data sets are shown with horizontal lines). Blood glucose: time—p < 0.0001; treatment—p < 0.0001; and time × treatment—p = 0.0002. Newman–Keuls post hoc test: *p < 0.05, **p < 0.01, and ***p < 0.001 (comprised data sets are shown with horizontal lines).