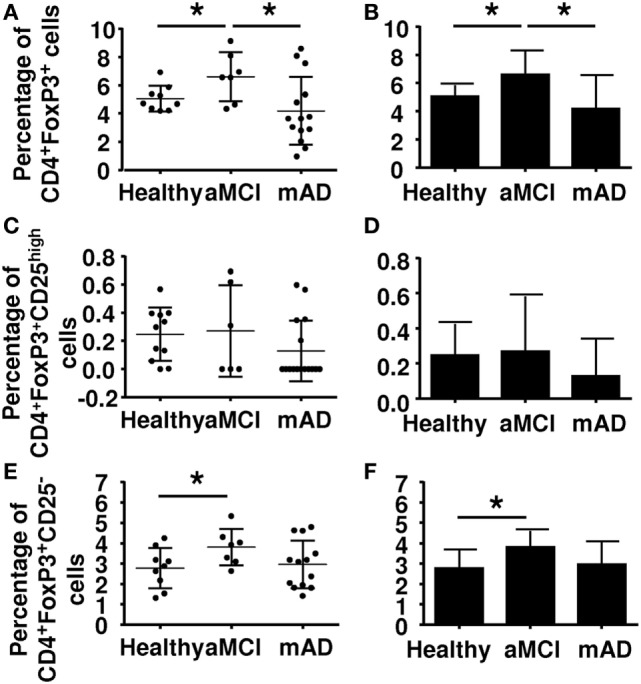
Figure 2.

Determination of the percentage of regulatory T cells (Tregs) in peripheral blood mononuclear cell of healthy, amnestic mild cognitive impairment (aMCI), and mild AD (mAD) subjects. (A) Tregs percentages defined by the CD4+FoxP3+ markers in individual participants. (B) Corresponding histograms. (C) Tregs percentages defined by the CD4+Foxp3+CD25high markers in individual participant. (D) Corresponding histograms. (E) T regs percentages defined by CD4+Foxp3+CD25− markers in individual participants. (F) Corresponding histograms. Each group was composed of at least five independent subjects with determinations made in triplicate. Data are shown as the mean ± SEM. The asterisks (*) correspond to p < 0.05.
