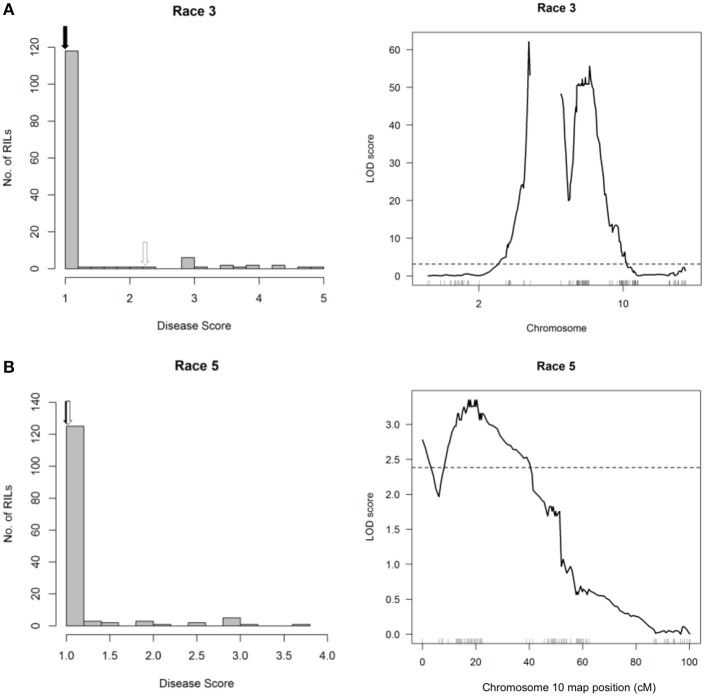
Figure 8.
Resistance mapping in the Phaseolus vulgaris Rojo × CAL 143 (RC) recombinant inbred population following separate inoculations with (A) Race 3 or (B) Race 5 of Pseudomonas syringae pv. phaseolicola does not detect a QTL interval on Pv04. (Left graphs) Distribution of interaction phenotypes exhibited by RC inbreds in glasshouse experiments. The phenotype scale ranges from highly resistant (score 1.0) to fully susceptible (score 5.0). White arrows denote the mean disease score for CAL 143 and black arrows denote the mean disease score for Rojo. (Right graphs) LOD profiles obtained by one-dimensional and two-dimensional genome scans. QTL models were fitted and refined using the multiple imputation method. Dashed lines denote significance at the 0.05 probability level.

