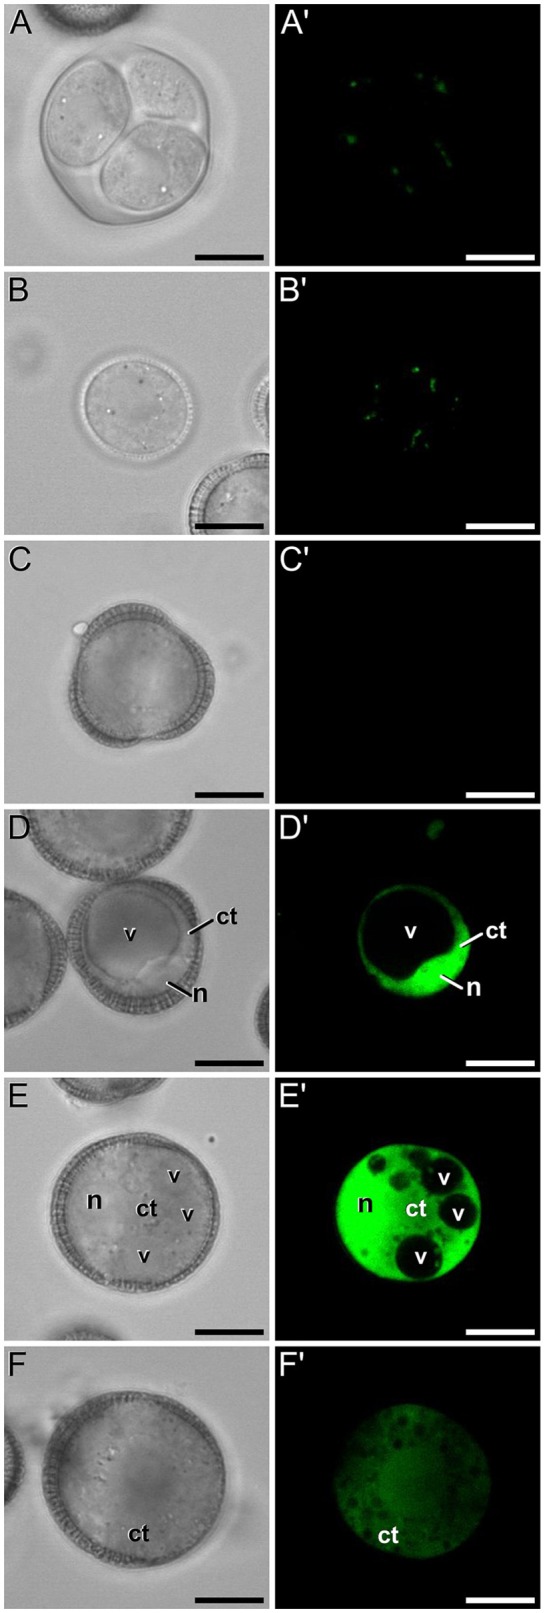
Figure 3.

FF staining during in vivo microspore/pollen development in rapeseed. Phase contrast (A–F) and fluorescence (A′–F′) pairs of pictures of a tetrad (A,A′), young microspore (B,B′), mid microspore (C,C′), vacuolate microspore (D,D′), young bicellular pollen (E,E′), and mid pollen grain (F,F′) are shown. ct, cytosol; n, nucleus; v, vacuole. Bars: 10 μm.
