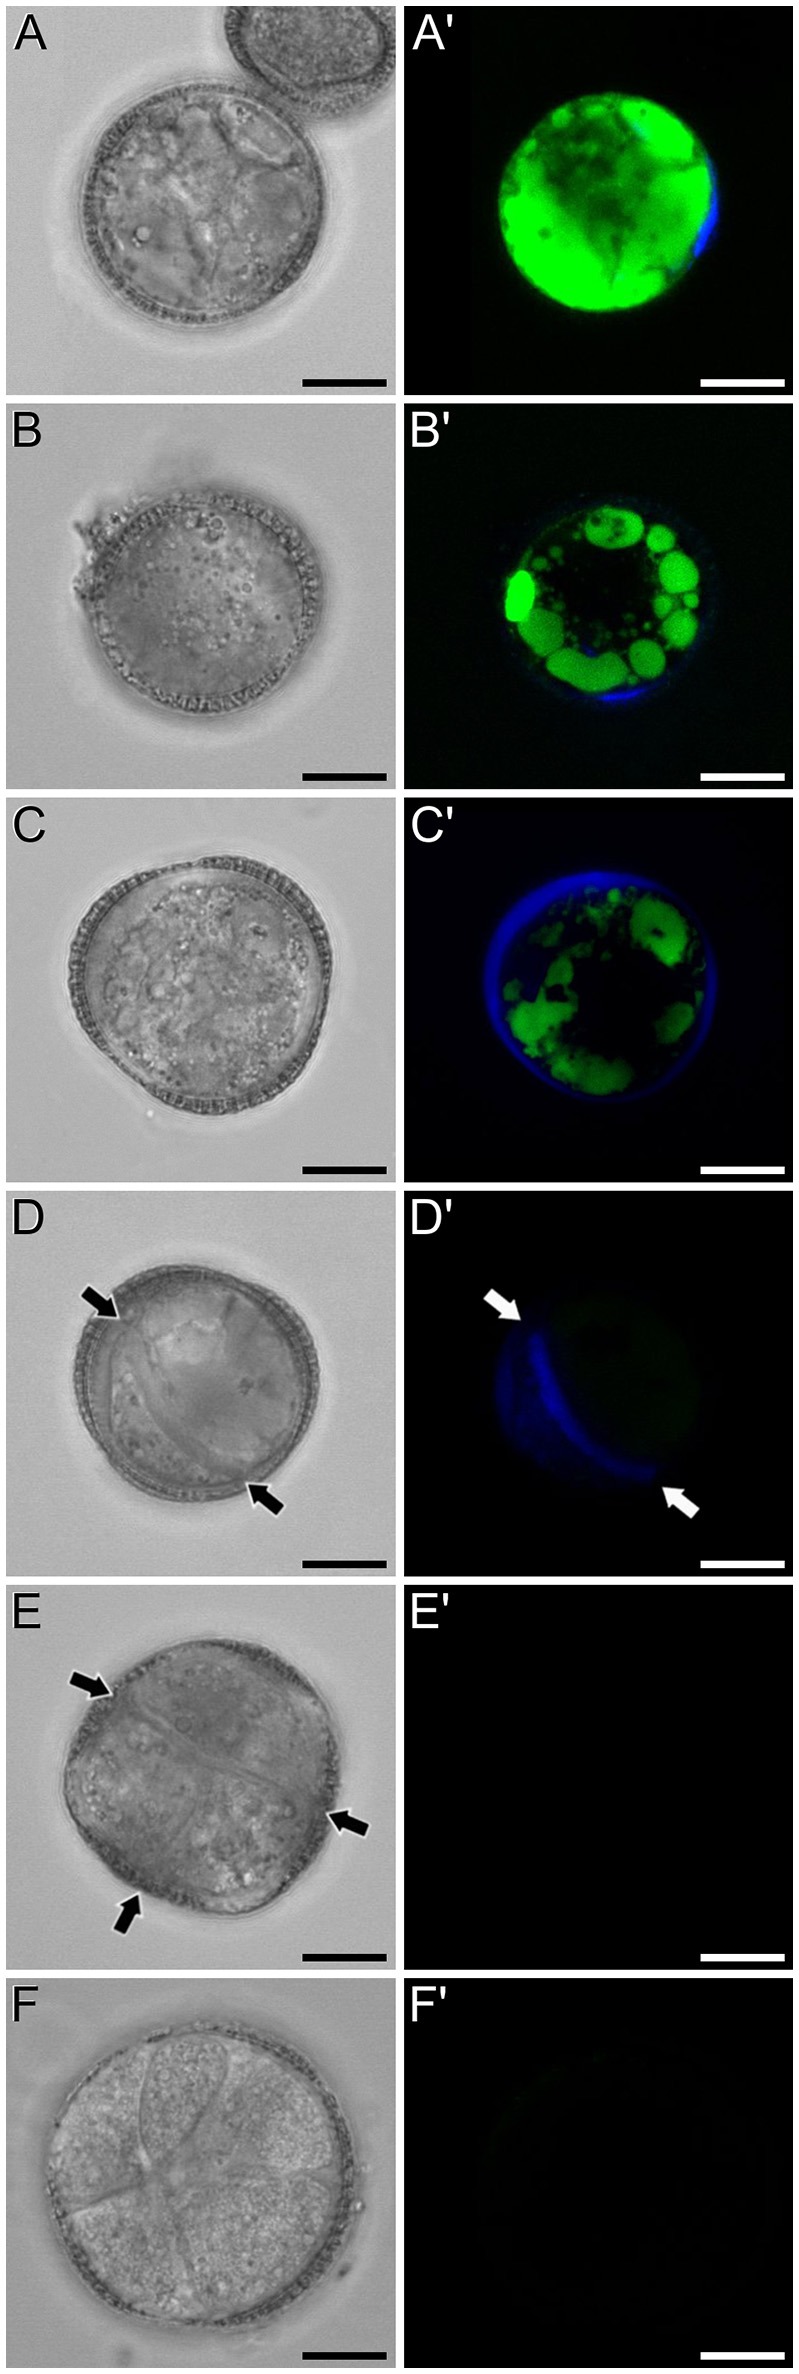
Figure 6.

FF and aniline blue staining during in vitro microspore embryogenesis in rapeseed. Phase contrast (A–F) and fluorescence (A′–F′) pairs of pictures are shown. (A,A′) Induced microspore showing high FF green signal, and few aniline blue stained regions below the intine. (B,B′) Microspore showing FF staining only in vacuoles, and aniline blue signal in the subintinal layer. (C,C′) Embryogenic microspore with decreased vacuolar FF signal and fully surrounded by aniline blue-positive subintinal layer. (D,D′) Embryogenic microspore with a clear aniline blue-stained cell division (arrows) and very low level of FF staining. (E,E′) Four-celled embryogenic structure (arrows indicate inner cell walls), without detectable fluorescent signal. (F,F′) Multicellular embryogenic structure without detectable fluorescent signal. Bars: 10 μm.
