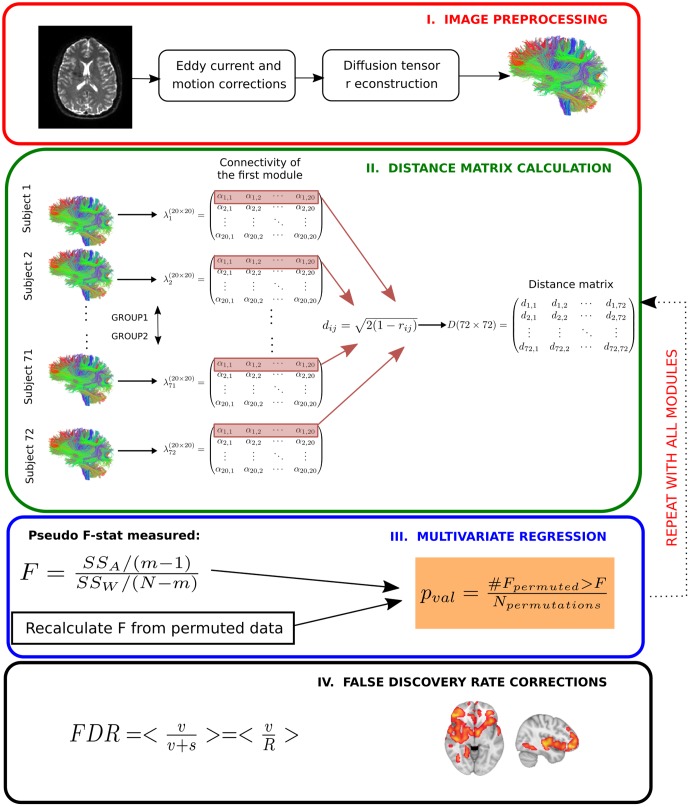
FIGURE 2.
Multivariate distance matrix regression analysis to find differences in brain connectivity patterns across severity progression of AD. In a first step (Image preprocessing in a red box), brain images are preprocessed by using standard techniques, mainly eddy current and head motion corrections). Next, diffusion tensor reconstructions are built that allows calculating the tractography for each subject (further details in Materials and Methods). In the next step (Distance matrix calculation in a green box), first the streamline number connectivity matrix is obtained (here, represented by λ), one per subject, corresponding to 20 × 20 entries of values given by α. Second, the connectivity patterns of subjects for a given module are used to construct the distance matrix in the subject space by means of Pearson correlation coefficients. Once the distance matrix for a given module is calculated (here, we highlight in red the first row that corresponds to the first module), we test in the third step (Multivariate regression in a blue box) whether the variability in distance between different groups is statistically related with disease, for which we compare the observed results with a simulated distribution given by N permutations of the labels. We repeat this operation for every module. We finally apply the fourth step (False discovery rate corrections in a black box) to correct for multiple comparisons.

