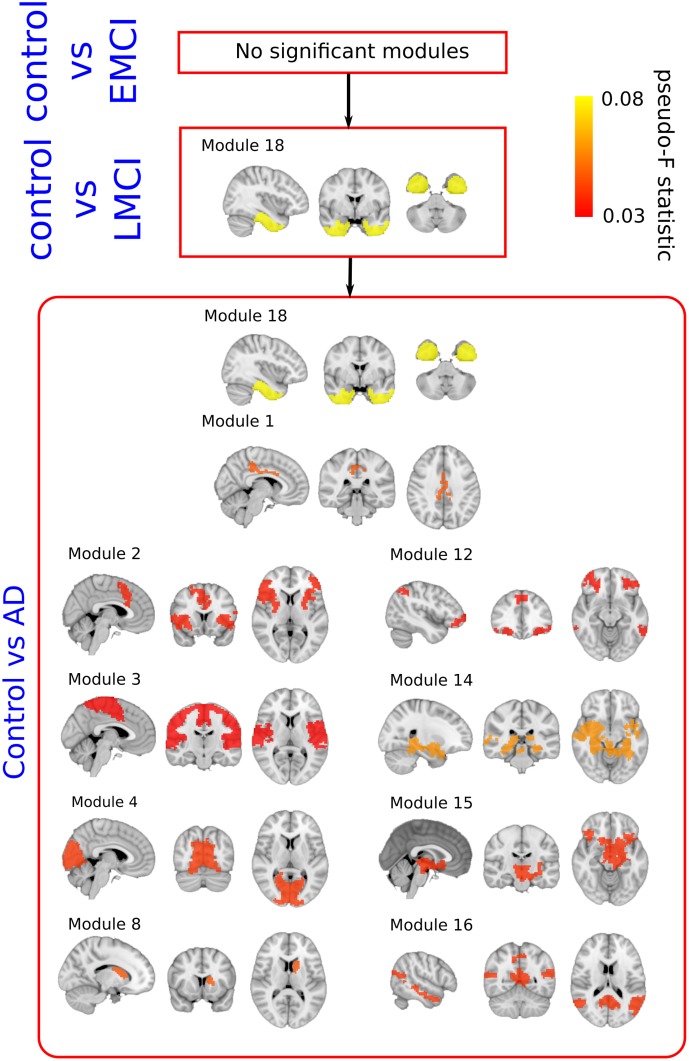
FIGURE 3.
Pseudo F-statistic brain maps across the severity progression of AD. Brain disconnection as disease progresses is quantitatively addressed by looking at the Pseudo F-statistic values of the modules. At first stages (Control vs. EMC, top), fibers deterioration is not sufficient to yield significant changes in modules connectivity patterns. In the following stage (Control vs. LMCI – middle), the connectivity pattern of module 18, which involves parts of the hippocampus, entorhinal cortex, amygdala and other memory-related areas, disconnects statistically with respect to control (p-value = 0.007). Such connectivity differences are widely spread to the rest of the brain at the final stage (Control vs. AD, bottom).

