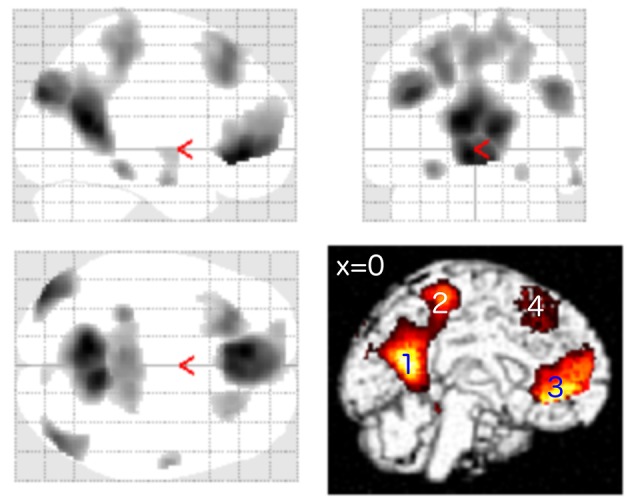
Figure 1.

One-sample t-test from first fMRI scan of all participants (n = 61) contrasting the inter-stimulus interval (ITI) against meaningful words. The figure presents the “glass brain” output of SPM as well as clusters overlaid on the median plane of a T1-weighted brain image. The task-negative condition comprised clusters in LP, PCC (1), precuneus (2), superior parietal lobe, ventro-medial PFC (3), supplemental motor area (4), and dorsolateral prefrontal cortex (p < 0.001 uncorrected for visualization; for more details see Table 2). These patterns were closely matched to the Default Mode Network (DMN).
