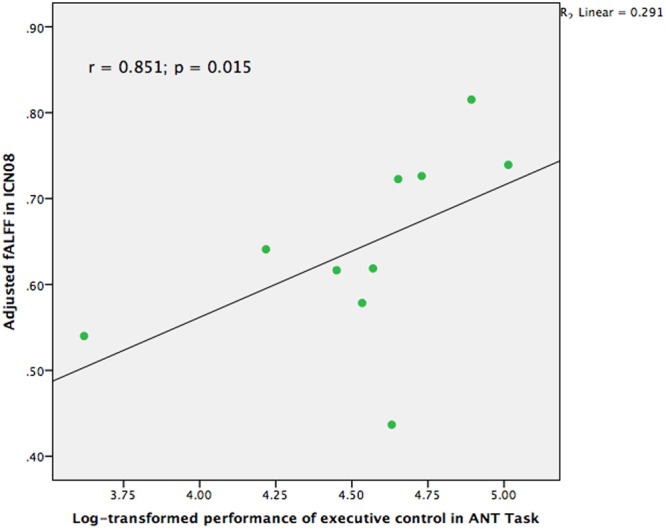
FIGURE 3.

Scatter plot indicating the correlation between fractional Amplitude of Low Frequency Fluctuation (fALFF) in ICN08 and log-transformed performance of executive control in Attention Network Test (ANT) task controlling for age, gender, and education (r = 0.851; p = 0.015).
