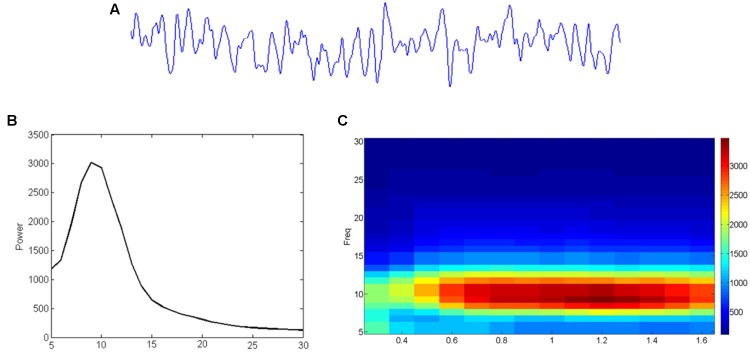
FIGURE 3.
From EEG time-signal (A) to a frequency (B) or even time-frequency (C) representation. (A) The time signal reflects how much signal (voltage) is picked up at an electrode/sensor at subsequent sample points. (B) A Fourier analysis can reveal to what extent (power; vertical axis) sinusoids in different frequencies (horizontal axis) contribute to it. (C) Similar analysis can reveal the development (time; horizontal axis) of such frequency (vertical axis) contributions (color-coding).

