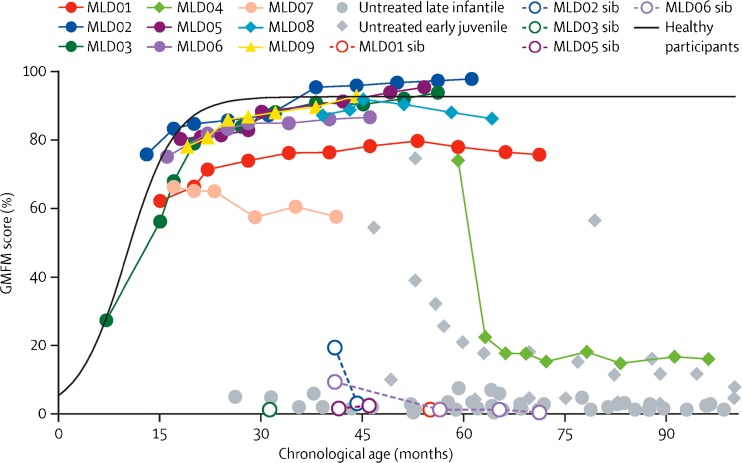
Fig. 4.
Effect of HSC-GT on motor functions. GMFM scores of patients who underwent HSC-GT (represented with colours) are compared to respective older affected siblings (open circles and dotted lines) and a historical cohort of untreated patients with late-infantile disease (grey circles) and early-juvenile disease (grey diamonds). The black line represents the estimated curve obtained from the scores from 34 healthy participants aged between 0 and 6 years (Sessa et al 2016)

