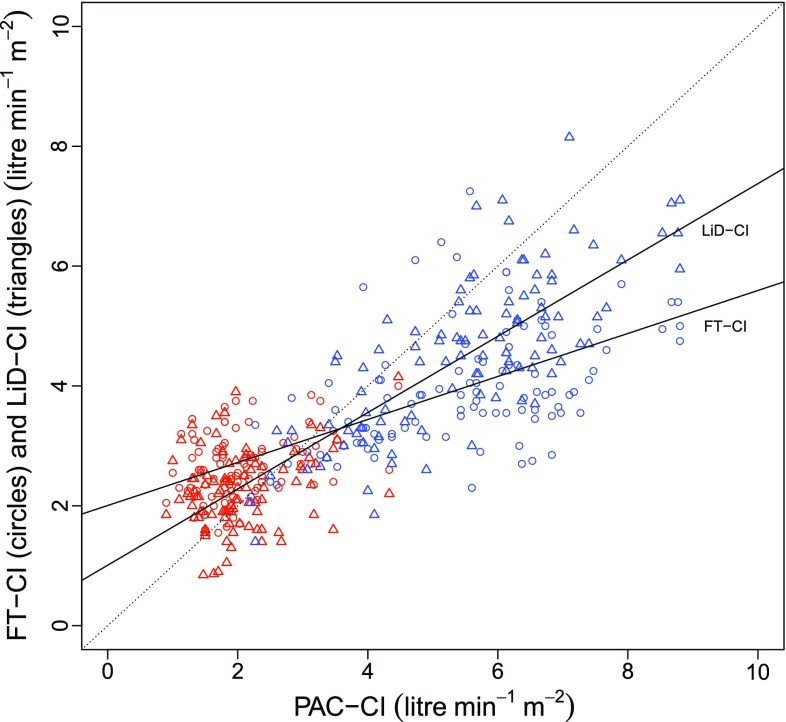
Fig. 1.
Scatter plot of all data (red OPCAB, blue LDLT). All analyzed data were plotted with the pulmonary artery derived cardiac index (PAC-CI) on the horizontal axis, the FloTrac/Vigileo™-derived CI (FT-CI) and the LiDCOrapid™-derived CI (LiD-CI) on the vertical axis. Linear regression analysis showed that y = 0.36x + 2.01 (R 2 = 0.48) for the FT-CI, and y = 0.64x + 1.01 (R 2 = 0.75) for the LiD-CI, respectively

