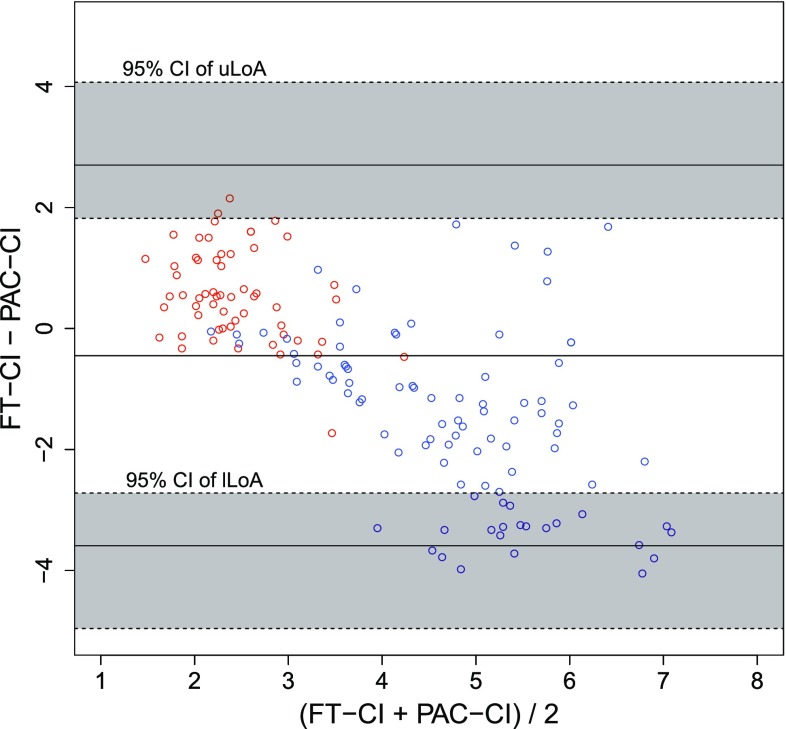
Fig. 2.
Bland−Altman plot for FT−CI (red OPCAB, blue LDLT). A Bland–Altman plot of the pulmonary artery catheter measured cardiac index (PAC-CI) and the FloTrac/Vigileo™-derived CI (FT-CI) with 95 % confident interval (CI) of upper limits of agreement (uLoA) and lower limits of agreement (lLoA). In line with the increase in (PAC-CI + FT-CI)/2, FT-CI was estimated to be lower than the actual value (R = − 0.71). A Bland–Altman analysis showed the bias (−0.45), percentage error (74.4 %), uLoA (2.70), lLoA (−3.59), 95 % CI of uLoA (from 1.82 to 4.07) and 95 % CI of lLoA (from −4.96 to −2.72)

