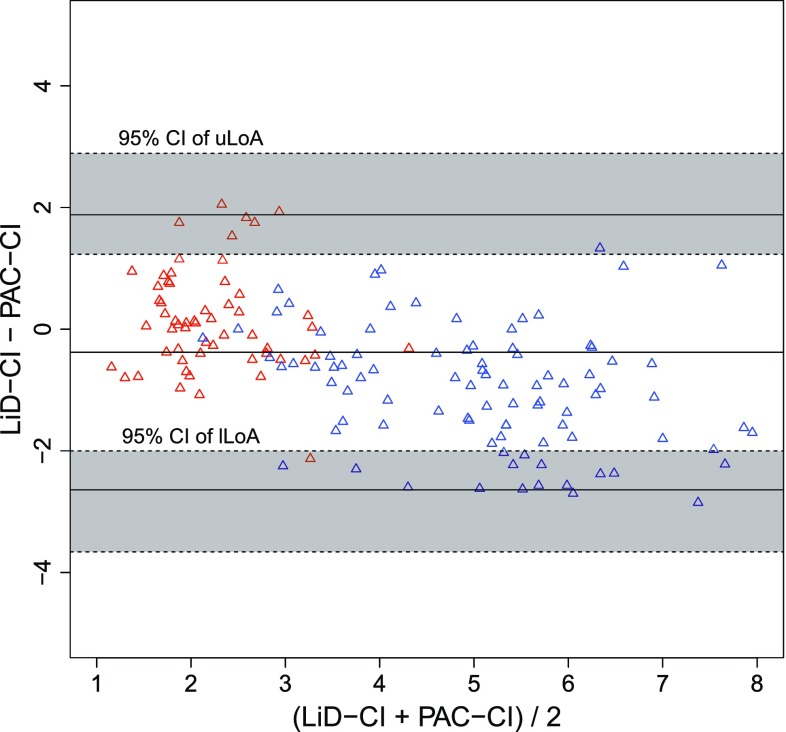
Fig. 3.
Bland−Altman plot for LiD−CI (red OPCAB, blue LDLT). A Bland–Altman plot of the pulmonary artery catheter measured cardiac index (PAC-CI) and the LiDCOrapid™-derived CI (LiD-CI). The tendency of underestimation when the increase of (PAC-CI + LiD-CI)/2 was less than that of FloTrac/Vigileo™ (R = −0.53). A Bland–Altman analysis showed the bias (−0.38), percentage error (53.5 %), uLoA (1.88), lLoA (−2.64), 95 % CI of uLoA (from 1.23 to 2.89) and 95 % CI of lLoA (from −3.66 to −2.00)

