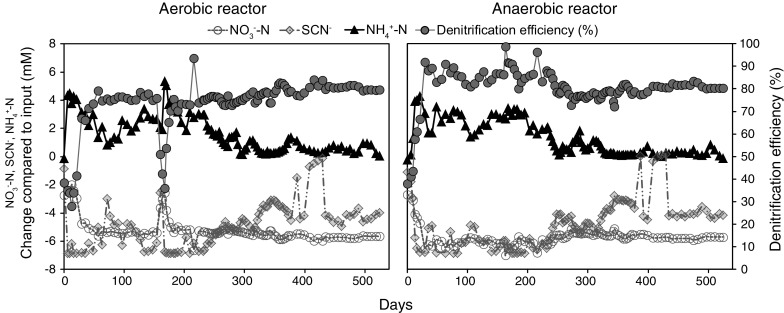
Fig. 2.

Changes in NO3 −–N, SCN−, and NH4 +–N concentrations over time compared to the input (7.1, 6.8, and 0.4 mM, respectively) in the aerobic R1 and anaerobic R2 SCN− fed bioreactor. Denitrification efficiency (% NO3 −–N removed from input) is shown on the right y-axis. One outlier SCN− value (+6.1 mM) was removed for the anaerobic bioreactor on day 57
