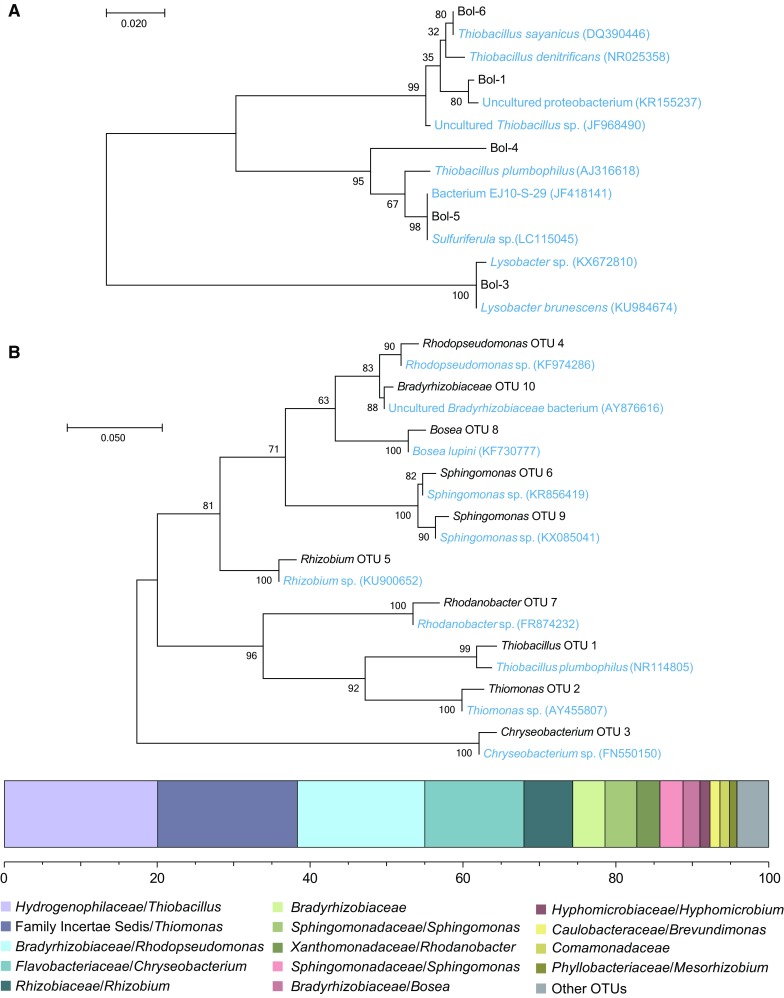
Fig. 6.

Identified partial 16S rRNA genes in the microaerophilic S2O3 2− fed R3 bioreactor inoculum culture and at the end of the experiment. a Phylogenetic tree of species compared to the inoculum from RFLP analysis, samples derived from unique restriction fragment patterns are labelled as Bol-1 to 6. b Phylogenetic tree and stacked bar chart of the dominant OTUs in the microaerophilic S2O3 2− fed bioreactor at the end of the experiment after 308 days. The tree with the maximum highest log likelihood (−2332.68) is shown, alongside close relative species (blue text) obtained from NCBI GenBank. In the stacked bar chart single OTUs are shown as family/genus (two technical replicates). The grouping “Other OTUs” comprises OTUs with less than 1% total relative abundance (among all samples summed)
