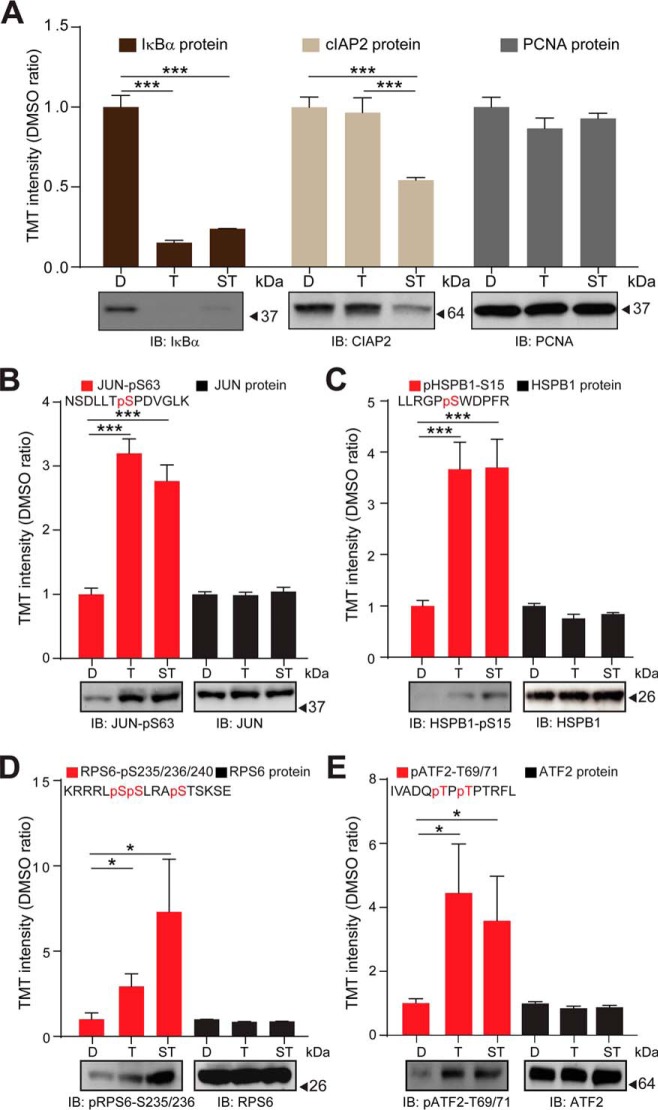
Fig. 4.
Validation of the TNFα and (SM+TNFα) regulated proteome and phosphoproteome as quantified by TMT-based mass spectrometry. A, Top panel: TMT signal to noise intensities across the DMSO control-treated, TNFα-treated and (SM+TNFα)-treated H1299 cells for IκBα (dark brown bars), cIAP2 (light brown bars), and PCNA (gray bars) proteins. Bottom panels: H1299 cells were DMSO control-treated (D), treated with TNFα (T) or (SM+TNFα)- (ST) and protein levels analyzed by immuno-blotting with the indicated antibodies. Blots were probed for PCNA as a loading control. B, Top panel: Relative TMT signal to noise intensities across the DMSO control-treated, TNFα-treated and (SM+TNFα)-treated H1299 cells for the indicated cJUN phosphorylated peptide (red bars) and the JUN protein (black bars). Bottom panel: H1299 cells were DMSO control-treated, treated with TNFα or (SM+TNFα) and the level of phosphorylated JUN analyzed by immuno-blotting with the indicated antibody. The blot was probed for JUN protein level as a loading control. C, As in (B), but for HSPB1. D, As in (B), but for RPS6. (E) As in (B), but for ATF2. Error bars represent quadruplicate measurements for DMSO and triplicate measurements for TNFα and SM+ TNFα + s.e.m. Data were analyzed by Student's t test, ***p ≤ 0.001, *p ≤ 0.05.

