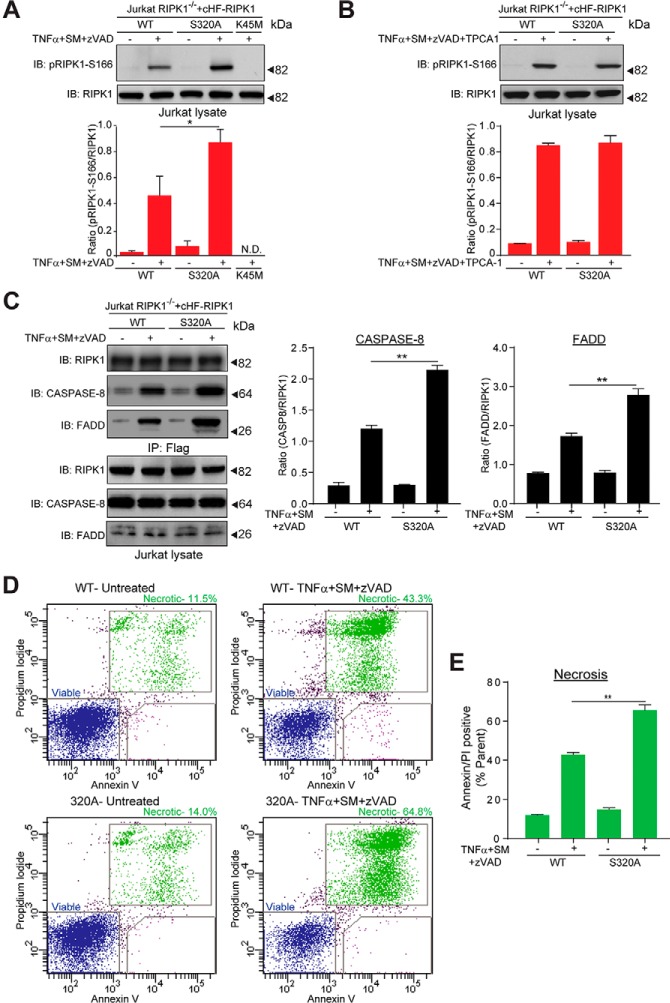
Fig. 6.
Ser320 on RIPK1 is important for its biological function. A, Upper panel: Representative immuno-blot comparing RIPK1 phosphorylation at Ser166 in Jurkat RIPK1−/− cells reconstituted with wild-type RIPK1, RIPK1-S320A, or RIPK1-K45M. The indicated cell lines were control-treated or treated for 30 min with zVAD and SM prior to 2 h TNFα exposure, the cells lysed, and immuno-blotted with the indicated antibodies. Lower panel: Quantification of the pRIPK1-S166/RIPK1 ratio for the immuno-blot. Data from three independent experiments were used for the quantification. B, As in (A), but the indicated cell lines were control-treated or treated for 30 min with zVAD, SM, and TPCA-1 prior to 2 h TNFα exposure. Lower panel: Quantification of the pRIPK1-S166/RIPK1 ratio for the immuno-blot. Data from three independent experiments were used for the quantification. C, Left panel: Representative immuno-blots comparing Complex II assembly in Jurkat RIPK1−/− cells reconstituted with wild-type RIPK1 or RIPK1-S320A. The indicated cell lines were treated for 30 min with zVAD and SM prior to 4 h. TNFα exposure, the cells lysed, Complex II isolated by immuno-precipitation with a Flag antibody, and the immuno-precipitates immuno-blotted with the indicated antibodies. The cell lysates were immunoblotted with the indicated antibodies to monitor total protein levels. Right Panel: Quantification of the CASPASE-8/RIPK1 and FADD/RIPK1 ratios in Complex II. Data from three independent experiments were used for the quantification. D, Representative dot plots of flow cytometry analysis to compare necrotic cell death in Jurkat RIPK1−/− cells reconstituted with wild-type RIPK1 or RIPK1-S320A. The indicated cell lines were control-treated (left) or treated for 30 min with zVAD and SM prior to 24 h TNFα exposure (right), and cell viability monitored by Annexin V and Propidium Iodide (PI) staining followed by flow cytometry. E, Quantification of the double positive stained cells in (D). Data from three independent experiments were used for the quantification. Error bars represent triplicate measurements + s.e.m. Data were analyzed by Student's t test, **p ≤ 0.01, *p ≤ 0.05.

