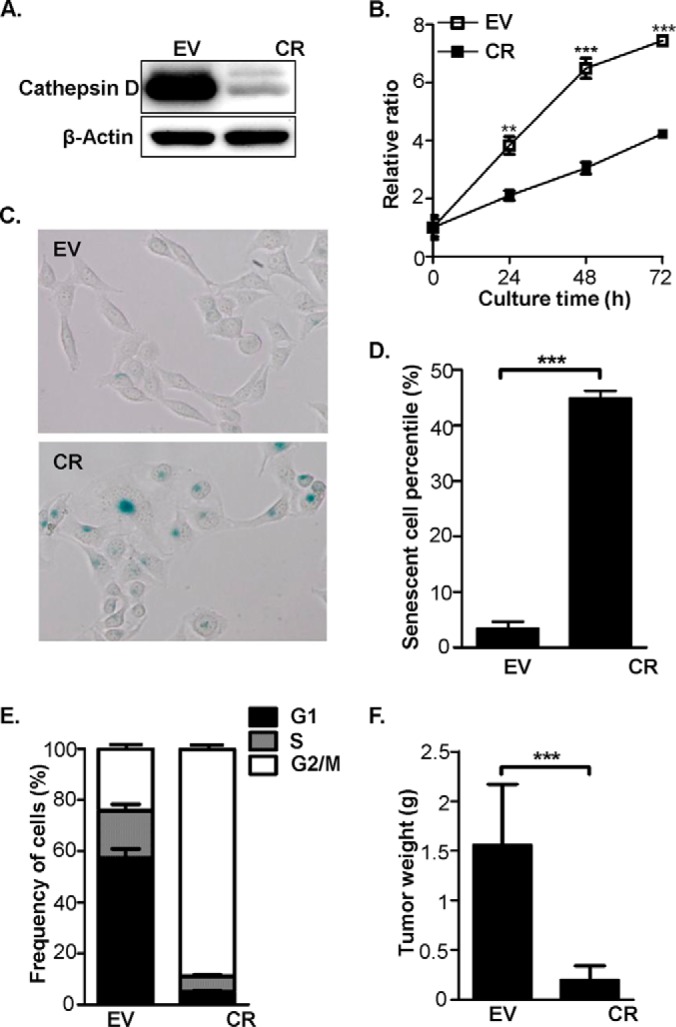
Fig. 1.

Cathepsin D knockdown induced multiple phenotype alterations in HeLa cells. A, The cathepsin D abundance was evaluated by Western-blot in EV and CR cells. B, The proliferation curves of EV and CR cells were drawn based on the data of MTT assay. The y axis data represents the ratios of the absorbance at 570 nm in CR against EV cells. C, Cell senescence was evaluated by SA-β-gal staining in EV and CR cells. D, Comparison of the positive ratios of SA-β-gal staining between EV and CR cells, which were derived from the numbers of SA-β-gal positive staining divided by the total cell numbers in each cell type. E, The cell cycle distribution patterns of EV and CR cells were estimated by a flowcytometer followed by software analysis with Modfit LT. F, The tumor cell growth in vivo was estimated by the nude mouse model, in which EV and CR cells were bilaterally and intravenously injected into 10 mice followed by weighing the tumor tissue after 4 weeks. In the above figures, the sign of ** represents p < 0.01 and *** as p < 0.001.
