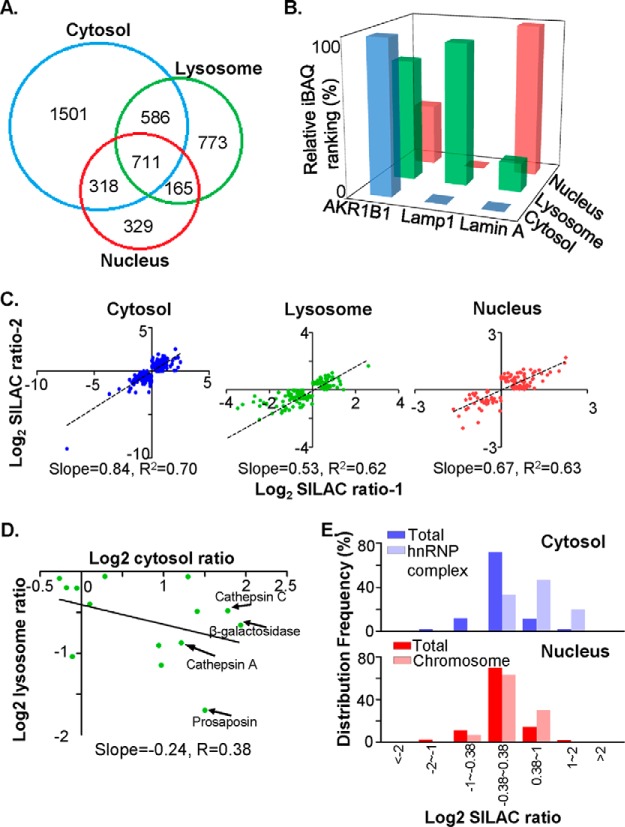
Fig. 2.
Quantitative proteomic analysis revealed that cathepsin D knockdown resulted in a global change in subcellular protein profiles. A, Overlap analysis of the proteins identified in each subcellular fraction (blue circle for cytosol, green circle for lysosome and red circle for nucleus). The numbers of identified proteins were shown on the Venn diagram. B, The relative iBAQ rankings for the marker proteins in three subcellular fractions, AKR1B1 for cytosol in blue, Lamp1 for lysosome in green, and Lamin A for nucleus in red. The relative iBAQ rankings were estimated as described in “Materials and Methods,” in which a protein with the highest iBAQ value was defined the relative iBAQ ranking as 1. C, Biological reproducibilities between two independent SILAC experiments were evaluated in the cytosol, the lysosome and the nucleus. SILAC ratios for each differential protein were log2 transformed, and the slope and correlation coefficency of linear fitting curve for each subcellular fraction were indicated. D, Evaluation of correlation efficiency of SILAC ratios among “lysosome” proteins between cytosol and lysosomal fraction. In proteins that were both quantified in cytosol and lysosomal fractions, the “lysosome” proteins, as indicated by Gene Ontology, were selected, and their SILAC ratios in cytosol and lysosomal fractions were log2 transformed and plotted on the dot plot. Specifically, the SILAC ratios of cathepsin D were removed. Several typical lysosome-residing proteins, such as cathepsin A and C, β-galactosidase and prosaposin, were indicated by arrows. E, The frequency distribution of selected protein subsets in cytosol and nuclear fractions were charted against their log2-transformed SILAC ratios. Note that proteins constituting hnRNP complex tend to increase abundance in cytosol, and proteins that were related with chromosome accumulate in nucleus of CR cells.

