Fig. 4.
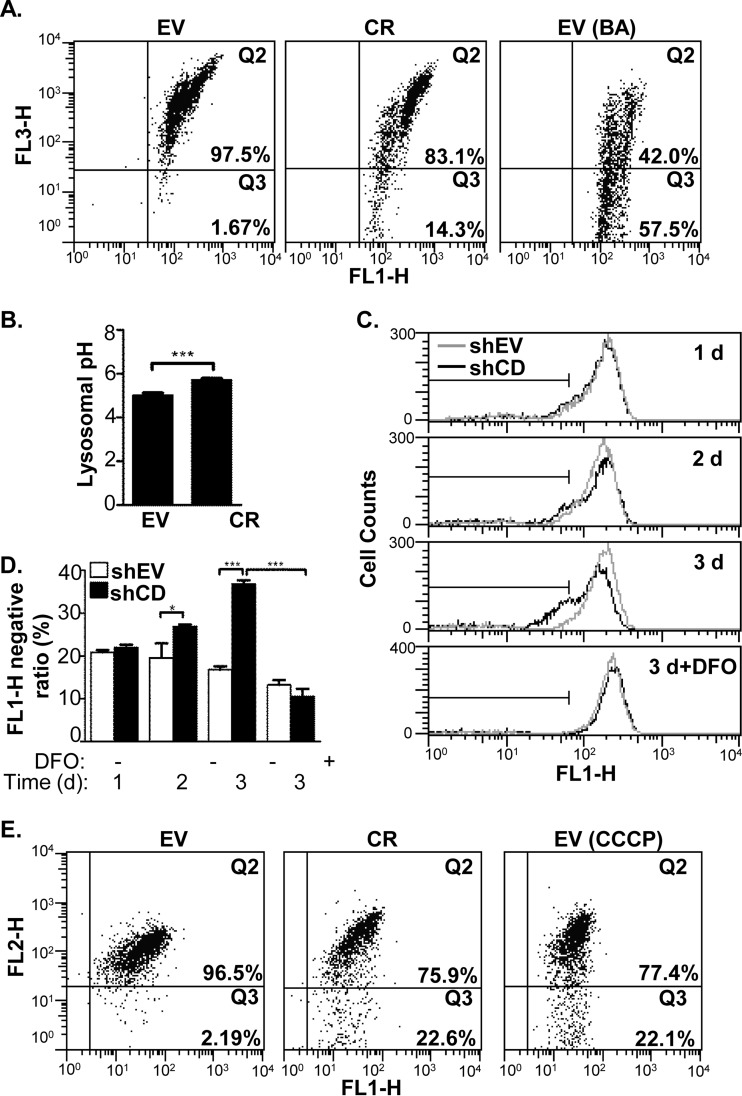
Cathepsin D knockdown induced the ROS-related events in HeLa cells. A, The LMP was estimated by AO staining in the HeLa cells, in which the fluorescence intensities on FL1-H (∼525 nm) and FL3-H (>670 nm) were measured by flowcytometry for EV cells (left panel), CR cells (middle panel), and EV cells treated bafilomycine A1 (BA) (right panel) as a positive control. B, The pH values of EV and CR lysosomes were estimated according to the calibration curve using the method described in “Experimental Procedures.” C and D, The LMP was evaluated by leakage of labile iron from lysosome. 1 to 3 days after transfection, both shEV and shCD cells were stained with calcein-AM, followed by measurement of their fluorescence intensities with flowcytometry at FL1-H channel. For desferoxamine (DFO) treatment, at 2 days after transfection, HeLa cells were treated with 0.25 μm DFO for additional 24h. Representative fluorescence intensity histograms were shown in (C). The gray line represents shEV cells and the black line stands for shCD cell. The ratios of cells with FL1-H fluorescence intensity value of less than 65 were calculated and shown in (D). E, Evaluation of ΔMMP on the HeLa cells using on flowcytometry at channel of FL1-H and FL2-H (∼575 nm). The EV cells (left panel), CR cells (middle panel), and EV cells treated with CCCP (right panel), were stained with JC-1, a dye for ΔMMP measurement, as described in “Experimental Procedures.” The sign of * represents p < 0.05 and *** as p < 0.001.

