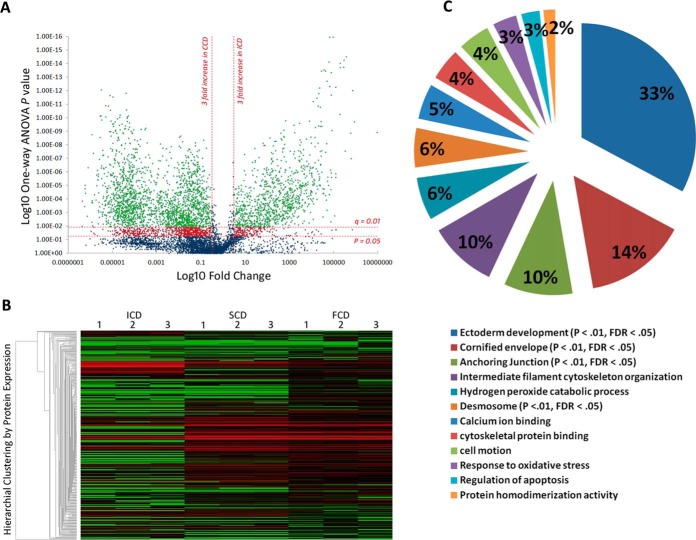
Fig. 1.
Discovery phase Proteomics identifies distinct low-mass serological protein profiles in CD behavioral phenotypes. A, Volcano plot summarizing low-mass molecular ion differences between ICD and CCD. Data points in the lower center area of the plot have a fold change close to 1 and a p value approaching 1, indicating no significant change. Points in the upper left and right quadrants indicate significant up- and downregulation. Points in green are ions significantly changing after FDR correction (q value) (n = 3960 ions sequenced to 859 peptides) and points in red are significantly changing but discarded to prevent type 1 error. B, Heatmap visualization of low-mass serological protein profiles of CD phenotypes. Each column represents a technical replicate of a pooled phenotypic sample, and each row is a protein (n = 348). The protein list is arranged by hierarchal clustering to form groups of like measurements. Red indicates up-regulation within the data set, black represents a median quantitative value and green indicates downregulation. Significantly enriched clusters of proteins in SCD and FCD (n = 161, p < 0.05, FDR q = 0.01) can be seen in the center of the graphic quantitatively visualized by red fill. C, Modules of biological function clusters annotated to the 172 modulating protein data set between CCD and ICD represented as percentages of total enrichment. The modules are identified by the top GO term annotated to that cluster. Significantly enriched biological functions (when compared with the background homo sapien genome) are indicated by an EASE score p value <0.05 and an FDR p value <0.01 after Benjamini-Hochberg correction.

