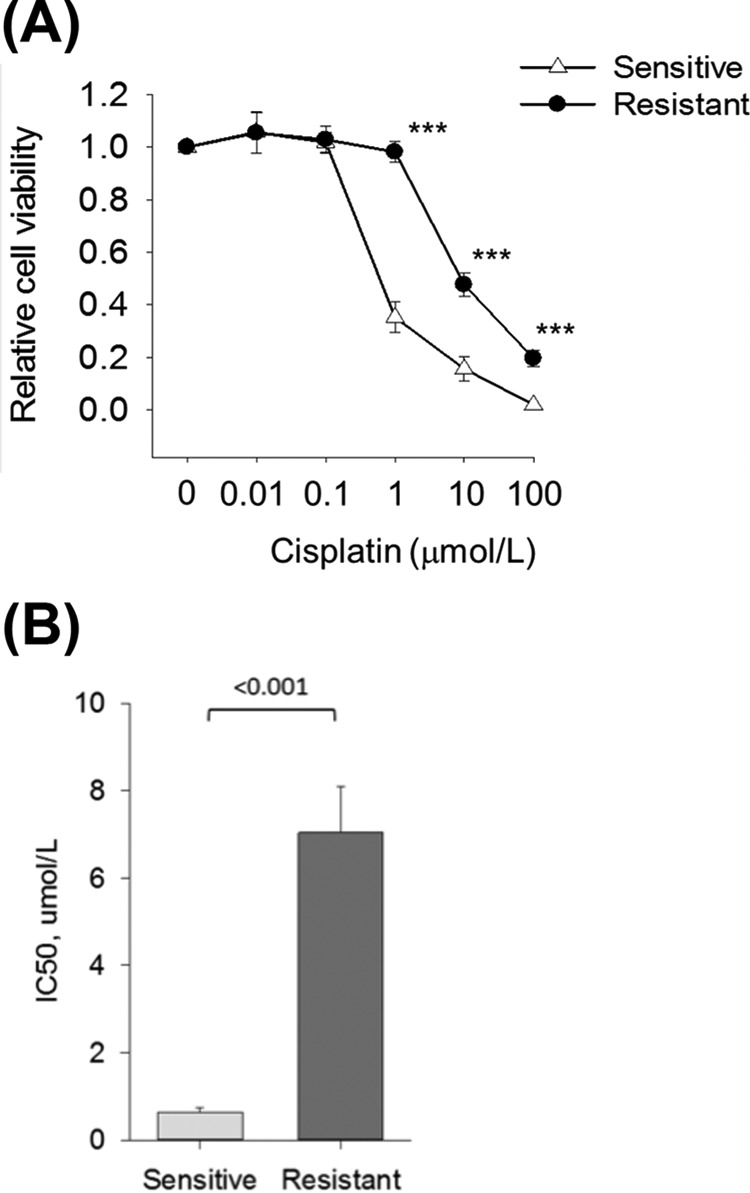
Fig. 1.

Cisplatin response in platinum sensitive M019i and resistant M019iCis cell lines. A, Relative cell viability as compared with untreated control. Statistical analysis between cell lines at different cisplatin concentrations were calculated using Student's t test (mean ± S.E., n = 5). *** p < 0.001. B, Half maximal inhibitory concentration (IC50) values of cisplatin for M019i (mean 0.630, S.E. 0.0476) and M019iCis (mean 7.038, S.E. 0.466) were calculated from five independent measurement. The IC50 concentrations of cisplatin were futher used to evaluate cells response to cisplatin at the molecular level.
