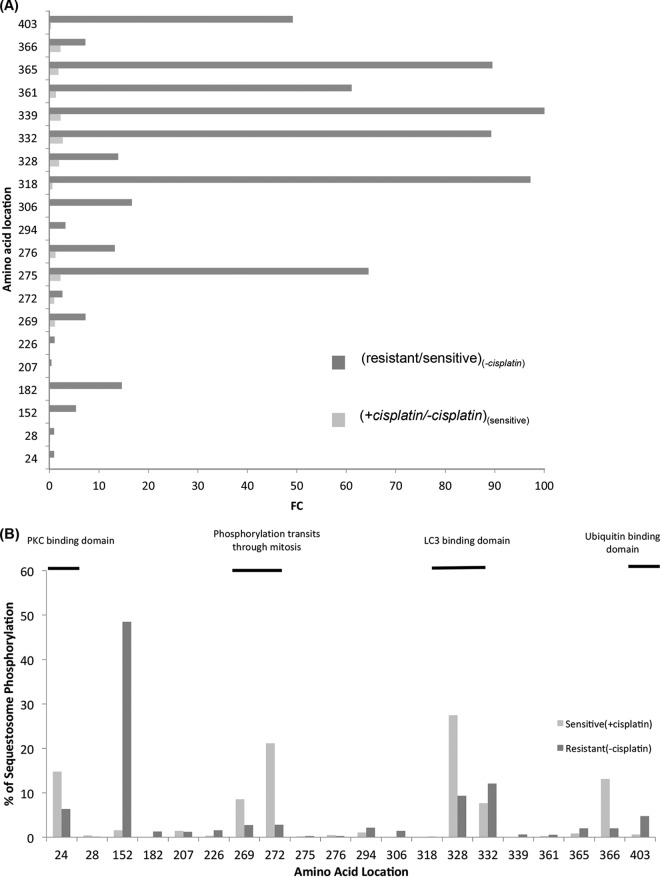
Fig. 7.
Comparative phosphorylation site analysis of SQSTM1 in (1) resistant versus sensitive cell lines in absence of cisplatin, and (2) presence of cisplatin versus absence in sensitive cell line. A, Fold change increase. B, Percent distribution of phosphorylation in resistant cell lines in absence of cisplatin and sensitive cell lines in presence of cisplatin.

