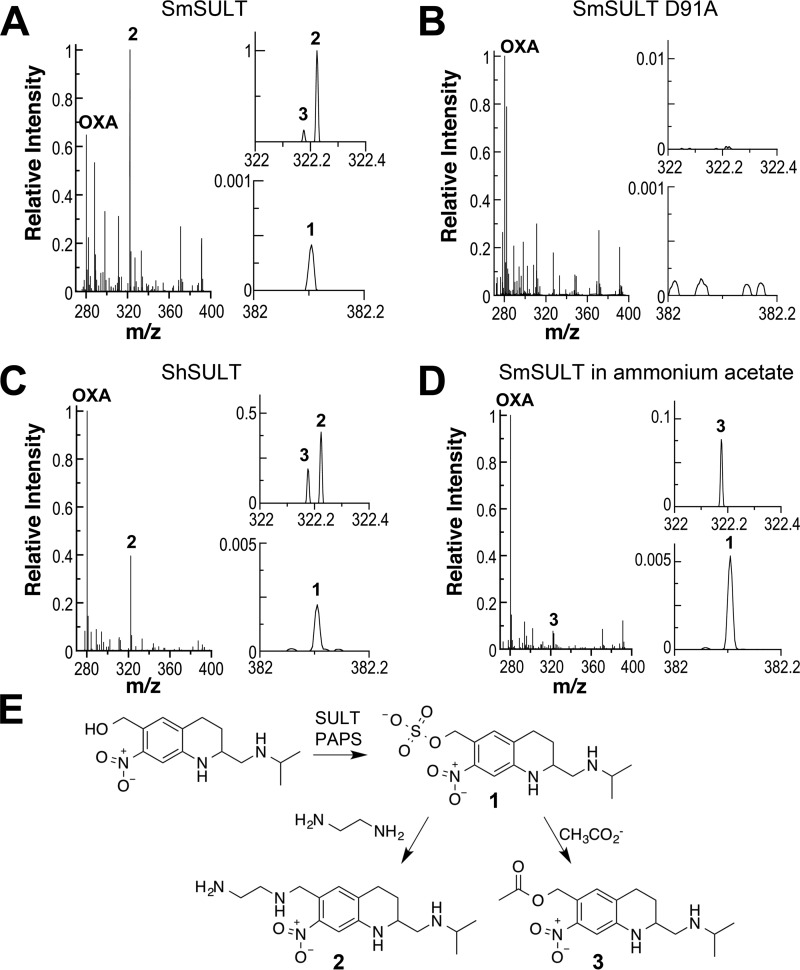
Figure 6.
Continuous-flow mass spectra of SULT reactions after 6 s. A, mass spectrum of the reaction of 10 μm SmSULT with 20 μm oxamniquine (OXA) and 50 μm PAPS in 50 mm ethanediamine acetate, 12.5 mm ammonium acetate, 5% methanol, pH 8.0. B, mass spectrum of the reaction of 10 μm SmSULT D91A with 20 μm oxamniquine and 50 μm PAPS in 50 mm ethanediamine acetate, 12.5 mm ammonium acetate, 5% methanol, pH 8.0. C, mass spectrum of the reaction of 10 μm ShSULT with 20 μm oxamniquine and 50 μm PAPS in 50 mm ethanediamine acetate, 12.5 mm ammonium acetate, 5% methanol, pH 8.0. D, mass spectrum of the reaction of 10 μm SmSULT with 20 μm oxamniquine and 50 μm PAPS in 12.5 mm ammonium acetate, 5% methanol, pH 7.0. The spectra represent averages of 200 scans at a flow rate of 1.0 μl/min at 25 °C. Ion signals are normalized to the most intense ion. E, proposed mechanism for formation of the products of the SULT reaction.

