Figure 3.
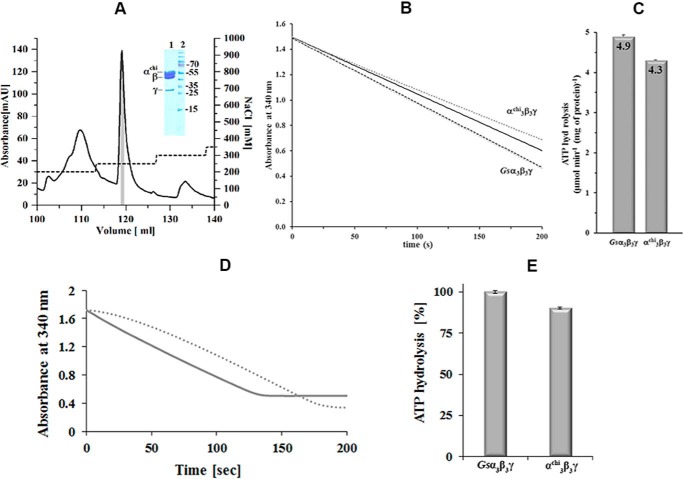
Purification of α3chiγ and ATP hydrolytic activity of Gsα3β3γ and α3chiγ. A, the chromatogram shows an elution profile of α3chiβ3γ using a Resource-Q column (6 ml). The inset in the figure reveals a SDS gel, which corresponds to the shaded area (gray) of the elution peak. The eluted α3chiβ3γ fractions were pooled and applied on the gel. Lanes 1 and 2 reveal the purified α3chiβ3γ and protein markers, respectively. The protein size in kDa is indicated on the right. B, continuous ATPase activity of Gsα3β3γ and α3chiβ3γ measured at 2 mm MgATP, 37 °C. Decrease in NADH absorption at 340 nm is plotted against time as dotted lines. The black lines show the linear least square fit for the first 10 s. C, specific ATPase activities of Gsα3β3γ and α3chiβ3γ determined from the slope of the least square fit. Values are the mean of 10 determinations. D, ATPase profile of nucleotide-depleted Gsα3β3γ (—) in a continuous ATPase activity assay measured at 2 mm MgATP. Bound MgADP was removed prior to activity measurements by incubating the protein with 5 mm Na-P and 10 mm EDTA for 30 min at 4 °C, and passing the enzyme samples through a Superdex 300TM column (GE Healthcare). (····) ATPase profile of Gsα3β3γ, which was preincubated with 100 μm MgADP for 30 min, revealing the MgADP inhibition effect, and confirming that tightly bound MgADP was removed due to the nucleotide depletion process of nucleotide-depleted Gsα3β3γ (—) described above. E, specific ATPase activities of the nucleotide-depleted Gsα3β3γ and α3chiβ3γ. Values are the mean of three determinations.

