Figure 5.
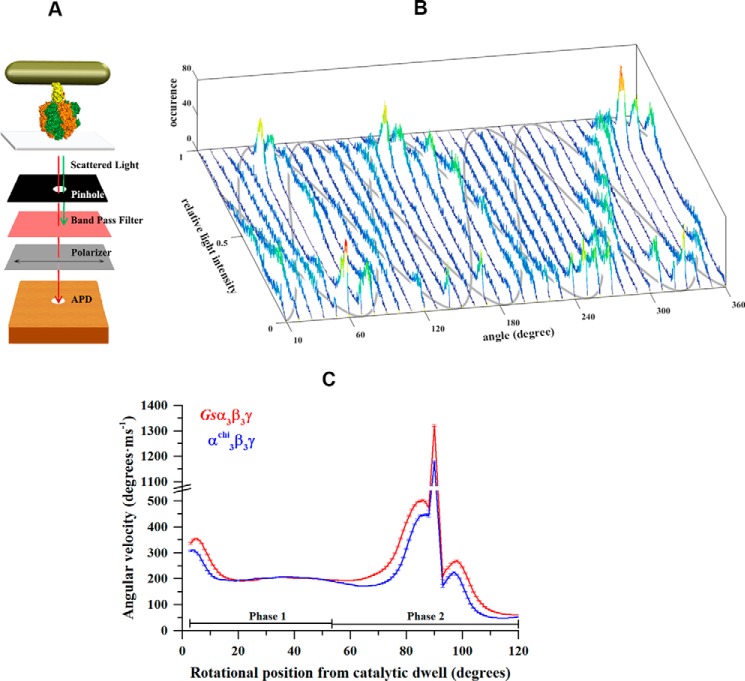
Single-molecule measurements of rotating gold nanorods complexed with Gsα3β3γ or α3chiβ3γ. A, schematic model of the microscope setup. Gold nanorods are illuminated by a dark-field condenser. Red polarized light scattered from a nanorod was recorded by an APD after passing through a polarizer. The model also shows the interaction of a gold nanorod with Gsα3β3γ or α3chiβ3γ. The protein Gsα3β3γ or α3chiβ3γ (subunits α, β, and γ in orange, green, and yellow, respectively) is attached via its His10 tags in subunit β to a coverslide, whereas an avidin-coated nanorod is attached to the opposing biotin modified cysteine in subunit γ. B, consecutive histograms of light intensities of a rotating nanorod attached to α3chiβ3γ upon rotating the polarizer in 10°-steps. The three peak positions in the histograms, resulting from the catalytic dwells of protein, follow a sinusoidal curve over 360° rotation of the polarizer. The approximate courses of the three sine curves are indicated in gray. C, average angular velocity over angular position at 1 mm MgATP of Gsα3β3γ (red) and α3chiβ3γ (blue). Each point represents the average over three neighboring angular positions.

