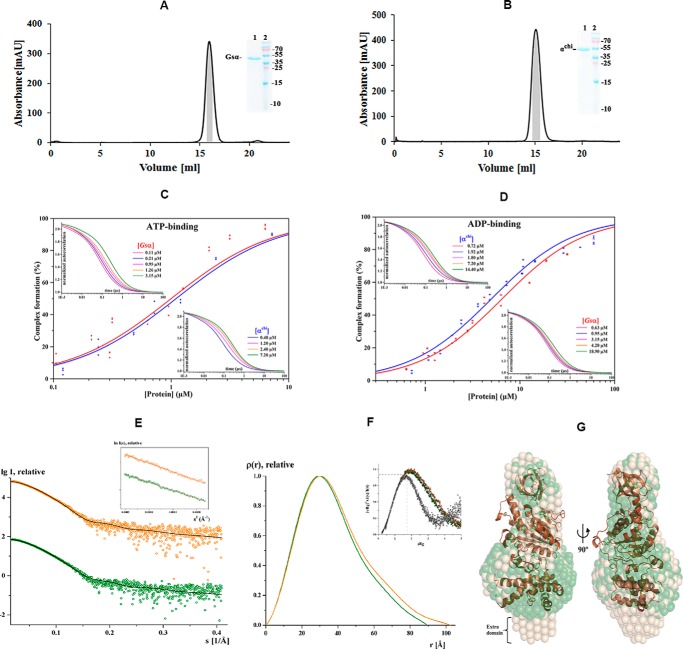
Figure 6.
Purification, FCS and solution X-ray scattering studies of Gsα and αchi. Final purification of Gsα (A) and αchi (B) with a Superdex 200 column. The inset shows an SDS gel, which corresponds to the shaded area (gray) of the elution peak, pooled, and applied on the gel. Lanes 1 and 2 reveal the purified protein and protein markers, respectively. Binding properties of subunits Gsα and αchi to fluorescently labeled nucleotides. C and D, results of FCS experiments, showing the binding of labeled nucleotides to subunit α. The upper left and lower right insets show the normalized autocorrelation curves of MgATP- (C) and MgADP-ATTO-647N (D) obtained by increasing the quantity of subunits Gsα and αchi (increased protein concentration from left to right). C, binding of subunits Gsα and αchi to MgATP-ATTO-647N and D, MgADP-ATTO-647N displayed as relative bound fraction versus protein concentration. The best fits to titration curves are shown as a non-linear, logistic curve fits. The percentage of complex formation for each concentration was calculated using a two-component fitting model. The binding constant, KD, was derived by fitting the data with the Hill equation. E, small angle X-ray scattering pattern (○) for Gsα (green) and αchi (orange). Fitting of the theoretical scattering curve (—) for Gsα computed by CRYSOL with the experimental scattering pattern (○) for Gsα (green) and αchi (orange) resulted in χ2-values of 1.44 and 1.46, respectively. The curves are displayed in logarithmic units for clarity. Inset, Guinier plots show linearity indicating no aggregation. F, pair-distance distribution function P(r) for Gsα (green) and αchi (orange). Inset, normalized Kratky plot indicating the folded nature of the protein. G, the average solution shape of Gsα (green) and αchi (wheat) as calculated by the DAMMIN program is overlapped with the crystal structure of Gsα (brown).

