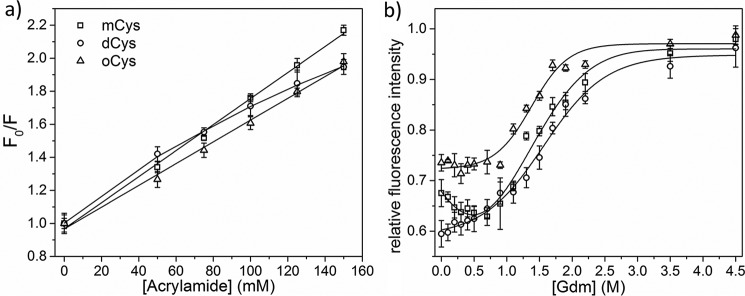
Figure 5.
a, acrylamide quenching in PBS, pH 7. 4, 22 °C, monitored at 350 nm emission. Lines are given by Stern-Volmer fits. b, denaturation of mCys, dCys, and oCys by GdmHCl addition. Lines are smooth fits. Average of 3 samples per data point is shown. Error bars represent standard deviation of samples.

