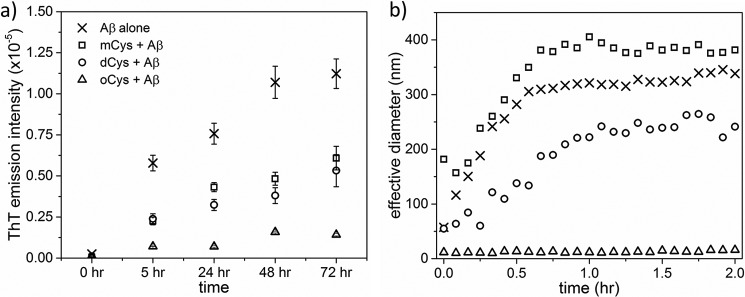
Figure 9.
Interaction of CysC fractions with Aβ peptide. Aggregation of Aβ (28 μm) in the presence of CysC at 2:1 (Aβ:CysC) molar ratio was monitored. a, ThT fluorescence emission. All co-incubation samples after the 0-h time point are statistically different from Aβ alone (p < 0.05). oCys co-incubation samples after 0 h are statistically different from other co-incubation samples (p < 0.05). Error bars are the standard deviation of 4 independent measurements. b, DLS mean particle size. Samples shown are representative of at least 3 independent samples.

