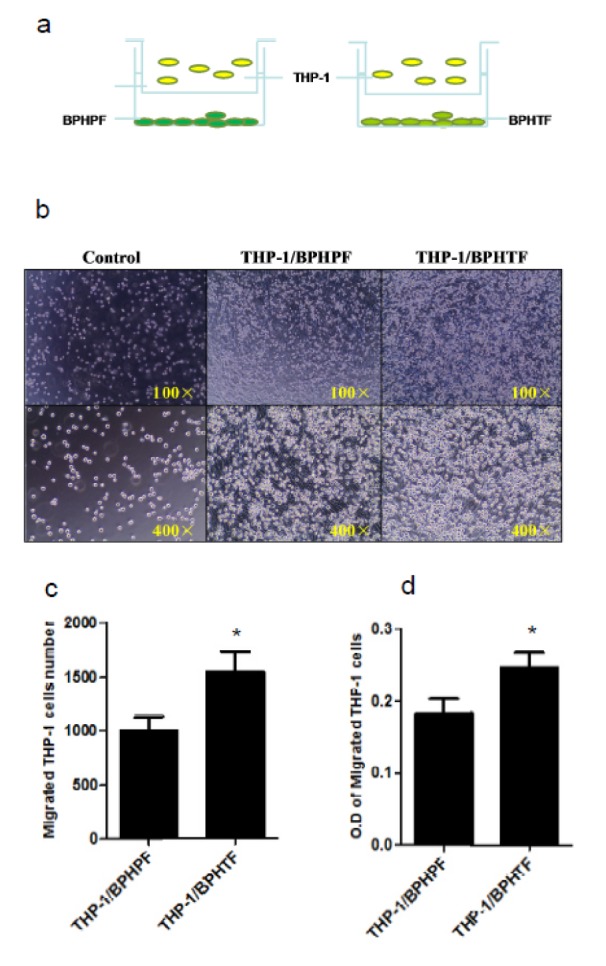
Figure 2. Differences in macrophage infiltration between BPHTF and BPHPF.

THP-1 cells (1*105/well) were co-cultured with control medium/BPHTFs or BPHPFs for 24 h in transwell plates (5 µm). Migrated macrophages were counted or assayed with MTT. Results are expressed as means ± standard deviations. Differences between the two groups were analyzed by two-tailed Student's t test; *P < 0.05
