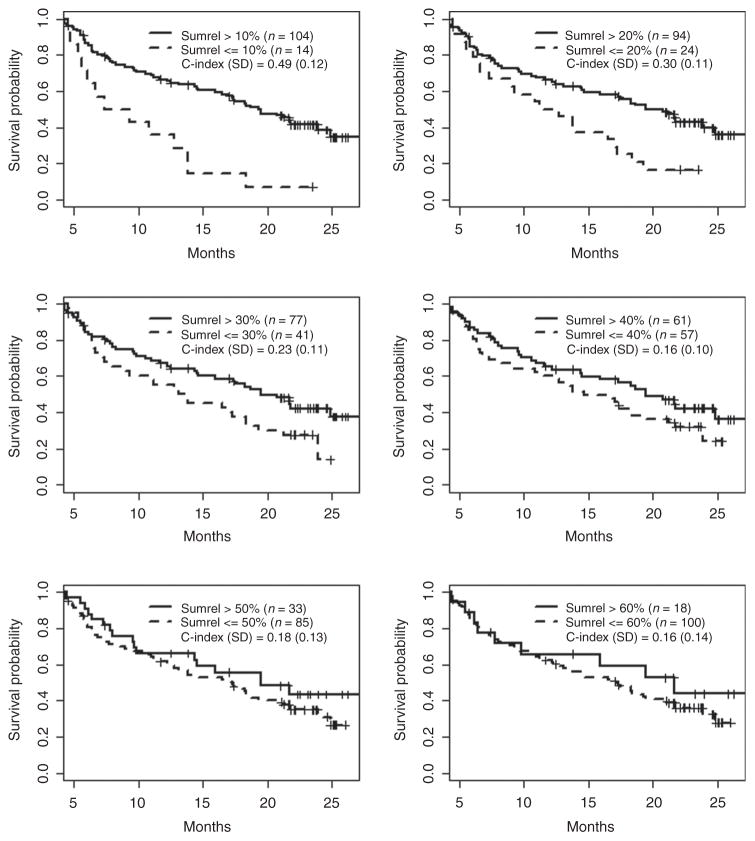
Figure 2.
Correlation of tumor response over the first 12 weeks with overall survival in all patients on BRIM2. Responses were defined as 10%, 20%, 30%, 40%, 50%, or 60% reduction in the sum of the target lesions. The weighted C-index was normalized to range between 0 and 1, and SDs were calculated using bootstrapping. Tick marks, censored patients.

